What Is Probability Distribution?
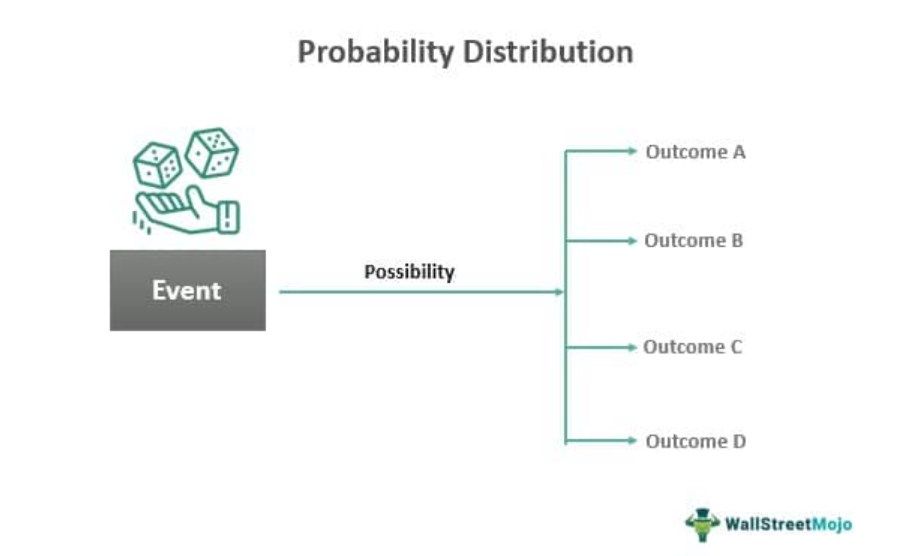
Probability distribution could be defined as the table or equations showing respective probabilities of different possible outcomes of a defined event or scenario. In simple words, its calculation shows the possible outcome of an event with the relative possibility of occurrence or non-occurrence as required.
From a business point of view, one can also use it for predicting or estimating the possible future returns or profitability of the business. In modern-day business, the probability distribution calculation is for sales forecasting, risk evaluation, finding and evaluating the obsolete part of any business or process, etc.
Key Takeaways
- The probability distribution is a table or set of equations that show the likelihood of several probable outcomes of a given event or situation.
- The calculation displays the most likely result of an affair and the relative probability of occurrence or non-occurrence as required.
- A probability distribution can record the possibility of an event occurring or not occurring.
- From a business standpoint, it can also be used to forecast or estimate the company’s potential future returns or profitability.
- The probability distribution calculation is used in modern business for sales forecasting, risk evaluation, locating, and calculating the obsolete element of any business.
Probability Distribution Explained
The normal probability distribution is a method or a function that tells us about the possibility or the likelihood or various results or outcomes that may occur related to an event. It is a process that can be used to analyse the certainty or uncertainty of an outcome.
This kind of distribution or analysis can be either discrete or continuous and provide a mathematical description of the associated probabilities. This method is extensively used in fields like statistics, engineering, finance, and many other areas of study. It is used to evaluate any random phenomena and make predictions.
Properties
Such a distribution has a number of properties as given below
- The possibility of an event occurring or not occurring lies between zero and one.
- The sum of all the probabilities is always one.
Thus, the normal probability distribution follows the above two properties.
Types
This method analysis events to find out or calculate the possibility of various outcomes. It can be of the following types:
Discrete Distribution – This can be applied only when the random variables can be in some limited numbers where the values can be counted. Each possible value is associated with a probability. Discrete probability distribution function can be a Poisson distribution, in which shows the occurrence of events within a fixed time interval and occur at a constant rate and independent of the time of the last event. Discrete can also be binomial or geometric distribution. A binomial distribution tells us about the chance of a value taking one out of the two independent values under a given set of assumptions. A geometric distribution tells us the chance of success after a certain number of failures.
Continuous Distribution – This is used when the random variable may take any particular value within a given range of values. Here, the probability is given to the intervals rather than specific values. Continuous distribution can again be normal, exponential or uniform distribution.
Therefore, the above are the two basic types of probability distribution function that are commonly used in various fields.
Formula
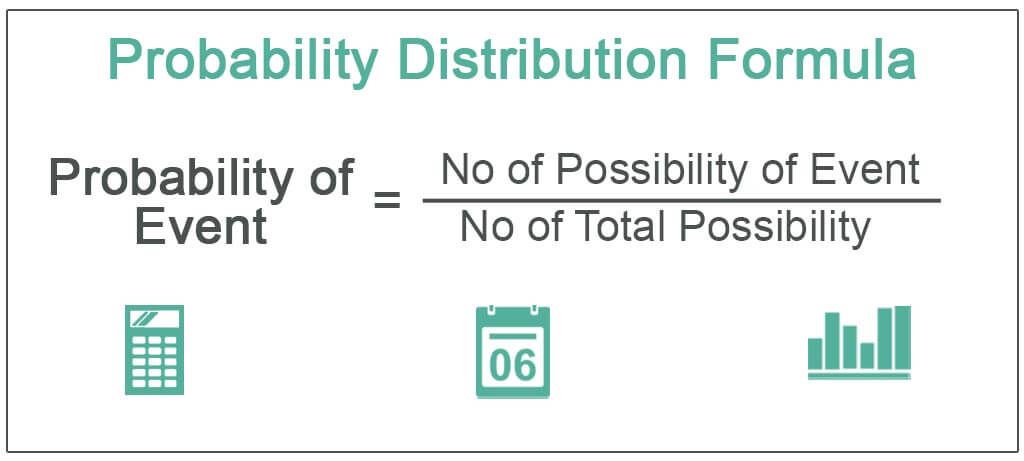
The probability of occurring event can be calculated by using the below formula;
Probability of Event = No of Possibility of Event / No of Total Possibility
Examples (with Excel Template)
Given below are the examples of the probability distribution equation to understand it better.
Example #1
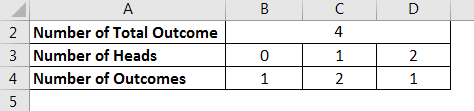
Let’s suppose a coin was tossed twice, and we have to show the probability distribution of showing heads.
Solution
In the given probability distribution table, possible outcomes could be (H, H), (H, T), (T, H), and(T, T).
Then possible no. of heads selected will be – 0, or one could calculate 1 or 2, and the probability of such an event by using the following formula:
Calculation of probability of an event can be done as follows,
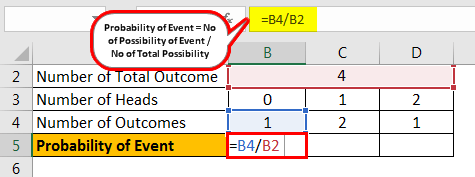
Using the Formula,
Probability of selecting 0 Head = No of Possibility of Event / No of Total Possibility
- = 1/4
Probability of an event will be –
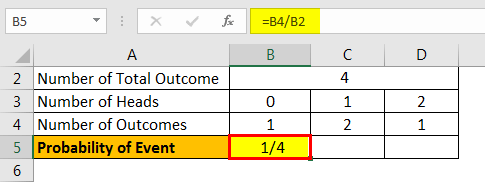
- =1/4
Probability of selecting 1 Head = No of Possibility of Event / No of Total Possibility
= 2/4
= 1/2
Probability of selecting 2 heads =No of Possibility of Event / No of Total Possibility
= 1/4
So, the probability distribution table for selecting heads could be shown as;
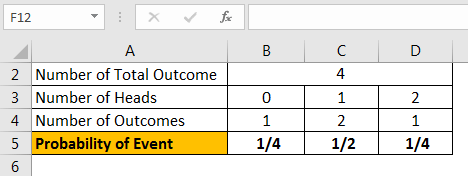
Explanation: The event was ‘No. of heads’ in the given example. And the number of heads that can occur is either 0 or 1, or 2, which would be termed as possible outcomes, and the respective possibility could be 0.25, 0.5, 0.25 of the possible outcomes.
Example #2
In an interview hall, there were 4 people present, consisting of 2 men and 2 women, after being tested by the interviewers. But the concerned company had only 2 vacancies to fill. So, the interviewer decided to select 2 candidates from the people in the hall. So, what will be the probability distribution of ‘selecting at least one woman.’
Solution
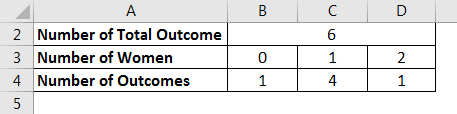
In the given case, the number of possibilities of selecting candidate could be,
(W1, W2), (W1, M1), (W1, M2), (W2, M1), (W2, M2), (M1, M2)
As per the requirement, let’s denote the event ‘number of women’ as X, then the possible values of X could be;
X = 1 or 2
Calculation of Probability of an event
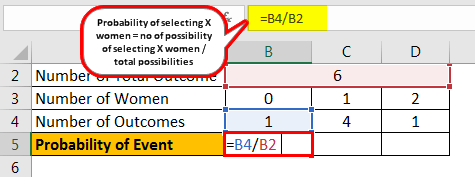
- So, the probability of selecting 0 women = no of the possibility of selecting 1 women / total possibilities
Probability of an event will be –
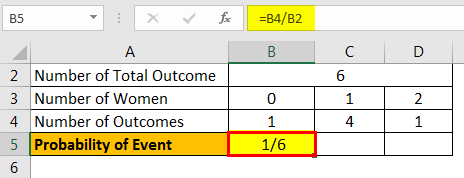
- =1/6
Similarly,
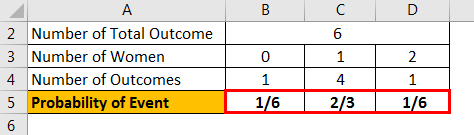
Probability of selecting X women = no of the possibility of selecting X women / total possibilities
- So, the probability of selecting 1 woman = no of the possibility of selecting 1 women / total possibilities
- =4/6
- =2/3
Similarly,
- Probability of selecting 2 women =no of the possibility of selecting 2 women / total possibilities
- =1/6
Now, as per the question, the probability of selecting at least 1 woman will be
- = Probability of selecting 1 woman + Probability of selecting 2 women
- = 2/3+1/6
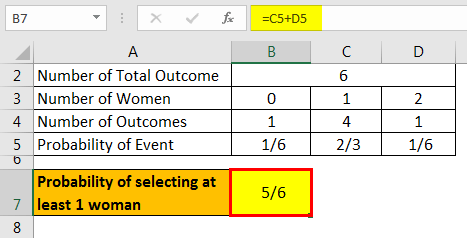
- =5/6
So, the probability distribution for selecting women will be shown as;
Explanation: In this scenario, the management decided to fill up the 2 vacancies through interviews, and during the interview, they chose 4 people. They decide to select randomly for the final selection, and the number of women selected could be either 0 or 1, or 2. The possibility of an event where no women would be selected is, and the possibility of an event where it will select only 1 woman amounted to. In contrast, the possibility of selection of both women is.
So, through probability distribution, the trend of employment, hiring, selection of candidates, and other nature could be summarized and studied.
Example #3
In a similar type of situation, let’s assume a situation where a manufacturing company named ABC Inc. was engaged in manufacturing tube lights. One day the Operation Manager decided to randomly evaluate the effectiveness of production by evaluating the percentage of damaged stocks produced within 1 hour. Let’s say, within 1 hour, they produced 10 tube lights, out of which 2 were damaged. The Manager decided to pick 3 of the tube lights randomly. Prepare the probability distribution of selecting damaged goods.
Solution
In the given example, the random variable is the ‘number of damaged tube lights selected.’ So let’s denote the event as ‘X.’
Then, the possible values of X are (0,1,2)
So, one could calculate the probability by using the formula:
Probability of selecting X = no of possibilities of selecting X / total possibilities
Then, Probability of selecting 0 damaged lights = probability of selecting good light in 1st round X probability of selecting good light in 2nd round X probability of selecting good light in 3rd round.
- P (0) = P(G) X P(G) X P(G)
- = 8/10*7/9*6/8
- = 7/15
Similarly, Probability of selecting only 1 damage light = [P(G) X P(G) X P(D)] X 3
(multiplied by 3 because the damaged light can be selected in 3 ways, i.e., either in 1st round or 2nd or 3rd round)
So,
- P (1) = (8/10*7/9*2/8)*3
- =7/15
Similarly, Probability of selecting 2 damage lights = [P(G) X P(D) X P(D)] X 3
(multiplied by 3 because the good light can be selected in 3 ways, i.e., either in 1st round or 2nd or 3rd round)
So,
- P (2) = (8/10*2/9*1/8)*3
- = 1/15
So the probability of selecting at least 1 Damaged lights = Probability of selecting 1 Damage + Probability of selecting 2 Damage
- = P (1) + P (2)
- =7/15+1/15
- =8/15
So, the probability distribution for selecting damage lights could be shown as;
Explanation: The Operation Manager of the business organization wanted to evaluate the effectiveness of the process by randomly selecting goods and evaluating the chances of producing damaged goods.
Through this example, we can see that the industry can also use Probability distribution to evaluate the effectiveness of its processes and the ongoing trends.
Uses
One may use a probability distribution for recording the possibility of the occurrence or non-occurrence of a certain event. Given below are some common uses of the same.
- Statistics – In the field of probability distribution in statistics, it is used to interpret data, make estimations about certain parameters or draw some inference or conclusion about a population. It is the basis of hypothesis testing, confidence interval and regression analysis.
- Assess risk – It is used to assess and manage risk. By inferring the probability of different types of scenarios, the company management and decision-makers in various fields can assess and manage risks.
- Forecasting – It is used for prediction and forecasting by using historical data and estimating the probability of future events. This is frequently used in stock markets, weather forcasting, and demand and supply analysis.
- Quality assessment – It is commonly used to assess the quality of products by calculating the variations and deviations in the characteristics of the goods and services.
- Simulation or modeling – It is very important in computer applications and simulations or modeling some complex processes. It provides an idea or a framework. Researchers simulate certain useful scenarios to study and analyse the behavior of the system. It is very common in physics, engineering, economics, etc.
- Artificial Intelligence – It is extremely useful in machine learning and artificial intelligence field to assess possibility or chance and make predictions.
Thus, the above are some important and useful applications of the distribution ranging from probability distribution in statistics to other decision related matters that help in managing and controlling uncertainties.
Frequently Asked Questions (FAQs)
What are the two requirements for a discrete probability distribution?
The two requirements for a discrete probability distribution are that every probability P(x) must be between 0 and 1: 0≤P(x)≤1. Secondly, the sum of all the possible probabilities is 1: ∑P(x)=1.
How to construct a probability distribution?
One may build a probability distribution by following the steps: firstly, one must write the number of widgets (things, items, products, or other named things) that are provided on one horizontal line. Secondly, underneath the first line, directly, one must write the event happening probability.
What is a probability distribution in statistics?
The probability distribution in statistics provides each outcome possibility of a random experiment. In addition, it gives the different possible occurrences probabilities.
What are the types of probability distribution?
The types of probability distribution are discrete probability distributions and continuous probability distributions.
Recommended Articles
This article is a guide to what is Probability Distribution. We explain its formula, types, along with examples, properties and uses. You can learn more from the following articles: –