What Is Vertical Analysis Of Income Statement?
Vertical Analysis refers to the income statement analysis where all the line items present in the company’s income statement are listed as a percentage of the sales within such a statement. It thus helps analyze the company’s performance by highlighting whether it is showing an upward or downward trend.
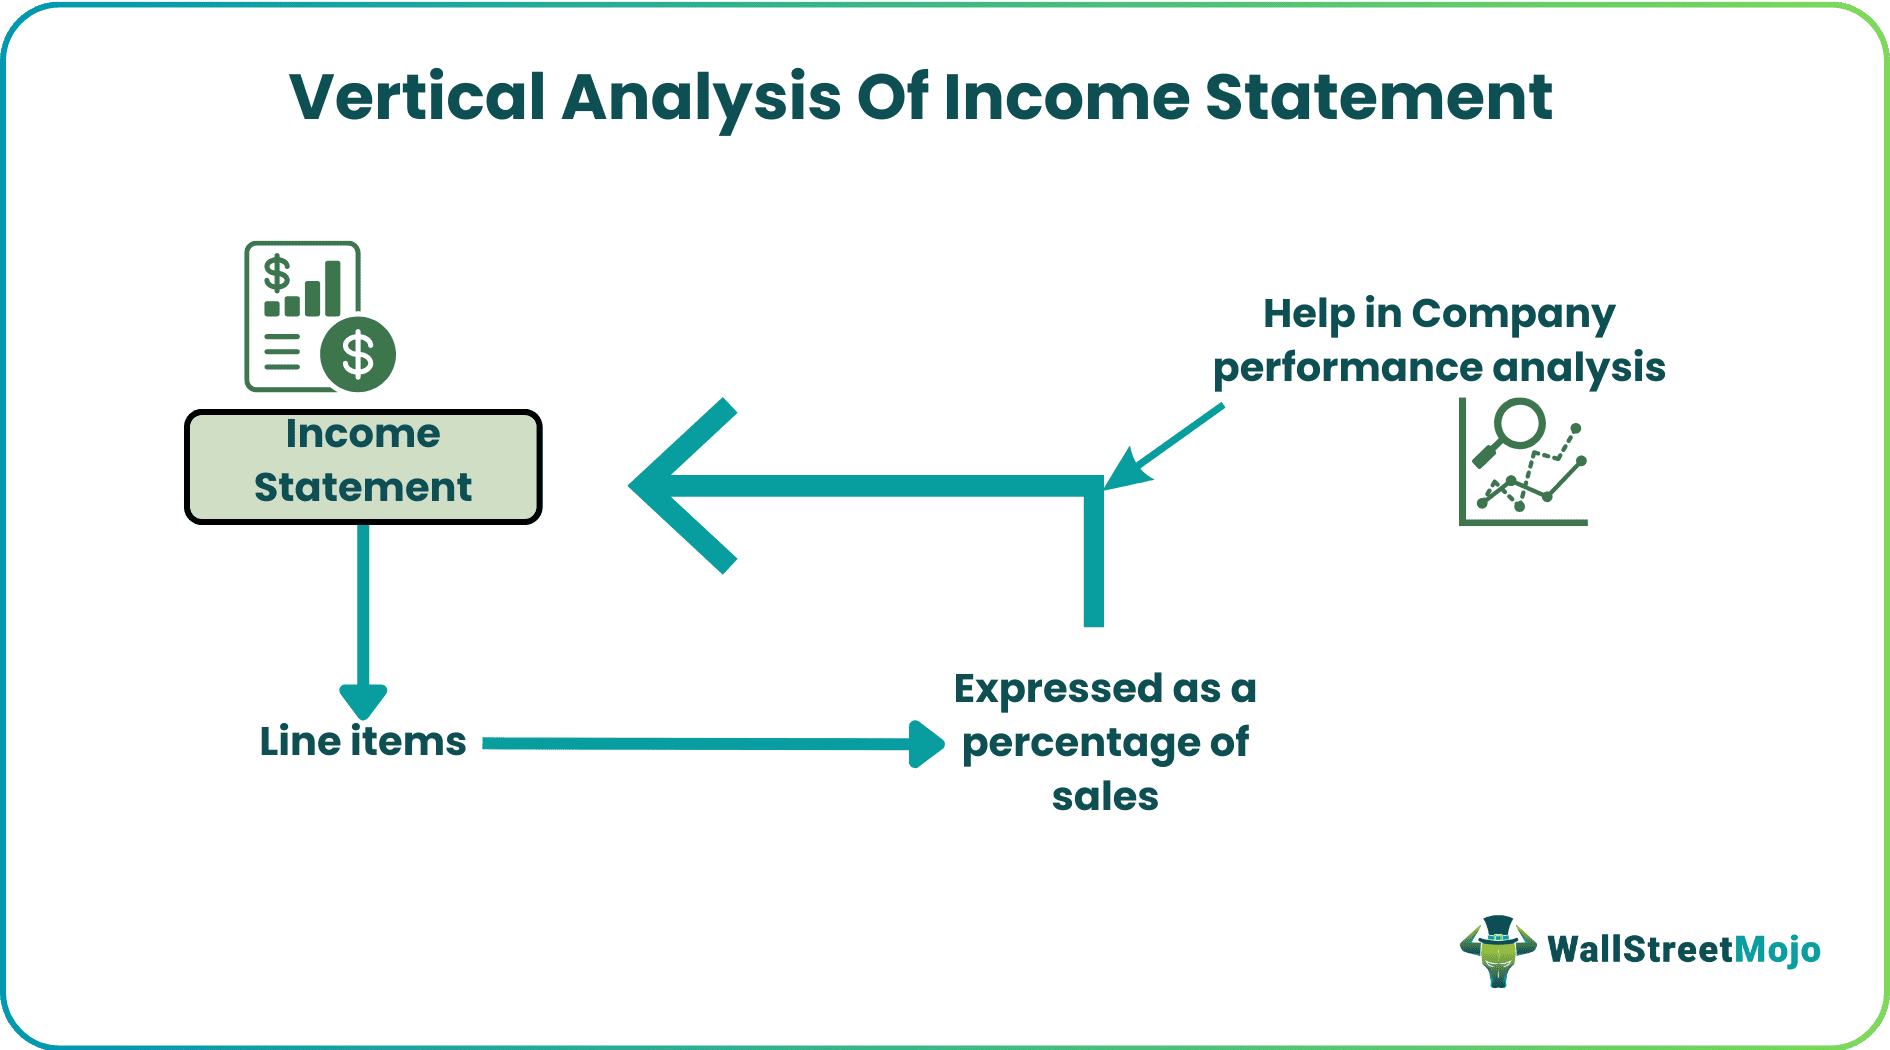
Vertical Analysis of the income statement shows the revenue or sales number as 100% and all other line items as a percentage of sales. All the line items in a vertical analysis are compared with another line item on the same statement; in the case of an income statement, it is revenue/net sales.
Key Takeaways
- Vertical analysis of income statement determines a company’s income statement by expressing each line item as a percentage of total sales, showing whether performance trends are up or down.
- In a vertical analysis of an income statement, revenue is set at 100%, and all other items are shown as a percentage of revenue. This analysis allows for easy comparisons between line items on the same statement.
- When comparing companies in the same sector, remember that vertical analysis of the income statement has limitations. Take these into consideration when inferring results.
Vertical Analysis Of Income Statement Explained
The common size or vertical analysis of the income statement is the statement where each line item is expressed as a percentage of sales. Comparing each number becomes easier when compared as a percentage of sales/revenue. While such an analysis is helpful for the analysts to compare the company’s performance over the years or two Companies in the same sector and line of business, it has its limitations. Thus, the analysis should consider the limitations of the vertical analysis of the income statement while comparing and inferring the results.
This concept of expressing the line item or a particular category of the income statement in terms of or as a percentage of the base amount is a very useful financial analysis technique. This base amount, which in this case, is the sales or revenue, provides a very useful platform for comparison of each item on a year on year or quarterly analysis.
It is also beneficial to prepare a vertical analysis of the income statement for investors or any other stakeholders who are interested in the company’s performance. They can make informed investment decisions based on these comparisons. It is also essential for the management from the point of view of growth and performance analysis. They can understand whether the strategies and policies that they implement regarding sales, revenue, marketing, etc are really contributing to the betterment of business performance.
The vertical analysis helps forecast the changes in the line items in both positive and negative directions. The management can identify areas of improvement or strength that are extremely useful for future planning. Thus, it provides insight into the business’s performance and financial structure.
Vertical Analysis Explanation in Video

How To Do?
The preparation of the income statement using vertical analysis technique involves some steps. The necessary steps to prepare a vertical analysis of the income statement are listed below:
- Collect the income statement – The correct income statement of the company has to be collected first. It should be related to the period for which analysis will be done. The statement must clearly list the details of the items related to revenue, expense, losses or gains.
- Select the base – The base selected in this case for calculation is the sales figure. The sales or the revenue represents the 100% scale and the other line items can be measured against this figure.
- Percentage calculation – Then comes the actual calculation of the percentage which is the main purpose of vertical analysis. Here each line item is taken and they are divided by the base amount of the sales figure and them multiplied by 100 to get the percentage value. This is the basic formula for vertical analysis of income statement.
- Creating the table – The final step is to clearly write down the calculated value in a separate line in an excel. The data should be properly organized against each line item so that that anyone who goes through the data can easily understand and interpret the result.
The above steps are essential formula for vertical analysis of income statement and the calculation and preparation of the statement. Correct and clear representation of the calculated figures help in identifying the trends and patterns or any significant variation and fluctuation in any of the line items. This also helps in pointing out the items that have a larger of smaller impact on the income statement.
Examples
Let us understand the concept with the help of some examples.
Let us see the example of vertical analysis of Colgate’s Income Statement. In the below snapshot, we have divided each income statement line item by Net Sales from 2007 to 2015.

Interpretation
- The cost of Sales has been in the range of 41%-44% historically. It implies that Colgate’s gross profit margin has been around 56% to 59%.
- There has been a decreasing trend in Selling General and administrative expenses from 36.1% in 2007 to 34.1% in the year ending 2015.
- We also note that Operating income dropped significantly in 2015 to 17.4%.
- The corresponding net income also decreased to 8.6% in 2015.
- Effective tax rates jumped to 44% in 2015.
Examples of Vertical Analysis of Income Statement
Let’s see some examples of vertical analysis of an income statement to understand it better.
Example #2
Consider the following example of an income statement of the XYZ Company:
| Year 1 | Year 2 | Year 3 | |
|---|---|---|---|
| Sales | $3,50,000 | $4,25,000 | $5,00,000 |
| Cost of Goods Sold | $1,00,000 | $1,35,000 | $1,70,000 |
| Gross Profit | $2,50,000 | $2,90,000 | $3,30,000 |
| Salaries | $95,000 | $98,000 | $1,00,000 |
| Rent and Utilities | $30,000 | $35,000 | $40,000 |
| Marketing | $20,000 | $25,000 | $30,000 |
| Other Expenses | $10,000 | $12,000 | $15,000 |
| Total Expenses | $1,55,000 | $1,70,000 | $1,85,000 |
| Net Income | $95,000 | $1,20,000 | $1,45,000 |
If we divide each line item for the year by the sales for that year, the common size analysis of the income statement of the Company will look like this:
| Year 1 | Year 2 | Year 3 | |
|---|---|---|---|
| Sales | 100% | 100% | 100% |
| Cost of Goods Sold | 29% | 32% | 34% |
| Gross Profit | 71% | 68% | 66% |
| Salaries | 27% | 23% | 20% |
| Rent and Utilities | 9% | 8% | 8% |
| Marketing | 6% | 6% | 6% |
| Other Expenses | 3% | 3% | 3% |
| Total Expenses | 44% | 40% | 37% |
| Net Income | 27% | 28% | 29% |
Interpretation
By converting each number by the sales number for the year, comparing the line items over the years is easy.
- The Company’s Gross Profit grew in dollar terms, but the gross profit % dropped over the years. It shows that the cost of the raw materials and goods has increased and is not in line with the increase in sales.
- The salaries of the employees have decreased over the years.
- Rent and utilities, marketing, and other expenses have remained more or less constant as a percentage of the sales.
- The net income has increased by about 1% every year.
Example #3
Let us look at another example: the income statement of Apple Inc.

Source: Apple SEC filings
If we convert the above into common size analysis of income statement, it will look like the following:

Vertical Analysis of Income Statement Interpretation
- All the numbers are more or less the same, with a difference of 1%-2% over the years.
- The net income of the Company has increased from 2016 to 2018 by 1.5%
- The Company’s expense on research and development has increased by nearly 1% as a percentage of net sales.
From the above examples it is possible to understand the exact procedure to calculate the line items as a percentage of sales from the financial statement of a company. The interpretation shows us how to evaluate the performance of the business using the numbers and make comparison. This not only provides an insight into the current financial condition of the company, but also contributes data to make a forecast about the future possibilities or trends of growth.
Advantages
Every financial concept has its own advantage and disadvantage. Let us try to identify the advantages first.
- Easy to Understand and Interpret: Vertical analysis of income statements is easy to understand and interpret. After converting the numbers on each line item into a percentage of sales, the analyst can compare them and analyze the performance of the Company better.
- Time Series Analysis: It helps in doing a time series analysis of the various line items like the expenses, employee salary, gross profit, operating profit, and net profit.
- Analysis can be done by looking at the common size sheet in one go. Since all the numbers are available as a percentage of the sales, the analysts can quickly analyze the details of the Company’s performance.
- Help in Analyzing Structural Composition: A common size analysis of the income statement helps in analyzing and ascertaining changes to any structural components of the income statement, i.e., the salary expense, marketing expense, depreciation, and amortization expense.
Limitations
Some important limitations of the concept are given below.
- No standard ratios: Since all the line items are divided by the common sales number, there is no standard financial ratio (except for profit margins) in the vertical analysis of the income statement. Hence, it may not be easy to make any decision based on such analysis and looking at the change in the percentage of various income statement components.
- Change in price-level/inflation: Vertical analysis of income statements does not consider the change in the price level or inflation effects. Sales numbers may be inflated every year due to inflation, but this is not considered as the numbers are not adjusted for inflation costs.
- Accounting principle consistency: If the accounting principles used are not the same year on year, then the income statement’s vertical analysis is useless until it is adjusted for the changes and made comparable year on year.
- Seasonal fluctuation: If the Company is involved in the sales of items that are seasonal, then the vertical analysis may not be helpful. The seasonal fluctuations cause variation in the sales cost of goods sold; thus, the numbers may not be comparable from one period to another.
- Window dressing: Window dressing or using accounting principles in favor of the Company cannot be recognized easily in the vertical analysis of the income statement. Such effects render the analysis useless.
- Qualitative analysis: It provides only quantitative analysis and does not consider qualitative measures taken by the Company like new marketing techniques etc.
Frequently Asked Questions(FAQs)
How will vertical analysis of an income statement help the decision maker?
This process helps to analyze the impact of each item in the income statement on the company’s profitability at different levels, including gross margin, operating income margin, and more.
What is the base amount most commonly in the vertical analysis of the income statement?
Net sales typically serve as the base amount when conducting vertical analysis on an income statement.
What are the appropriate bases for vertical analysis of an income statement?
The balance sheet uses the total assets or liabilities as the starting point in the vertical analysis. In contrast, the income statement uses total revenue or sales as the starting point.
How often should vertical analysis of the income statement be conducted?
The frequency of conducting vertical analysis depends on the company’s reporting requirements and the need for financial analysis. It can be done quarterly, annually, or whenever there is a need to evaluate financial performance.
Recommended Articles
This article has been a guide to what is Vertical Analysis Of Income Statement. We explain how to do it with examples, advantages and disadvantages. You can learn more about financial analysis from the following articles-