Table Of Contents
Income Statement Definition
An income statement is a financial report that summarizes the revenues and expenses of a business. This document gauges the financial performance of a business in terms of profits or losses for the accounting period.
The income statement follows a specific format. First, sales and revenue figures are recorded right at the top, which is followed by other income streams. Only then are the expenses deducted from total income. Ultimately, the document reveals the net profit/loss accrued by the business.
Table of contents
- Income Statement Definition
- An income statement is a profitability report. It records revenues, gains, expenses, and losses to evaluate net income.
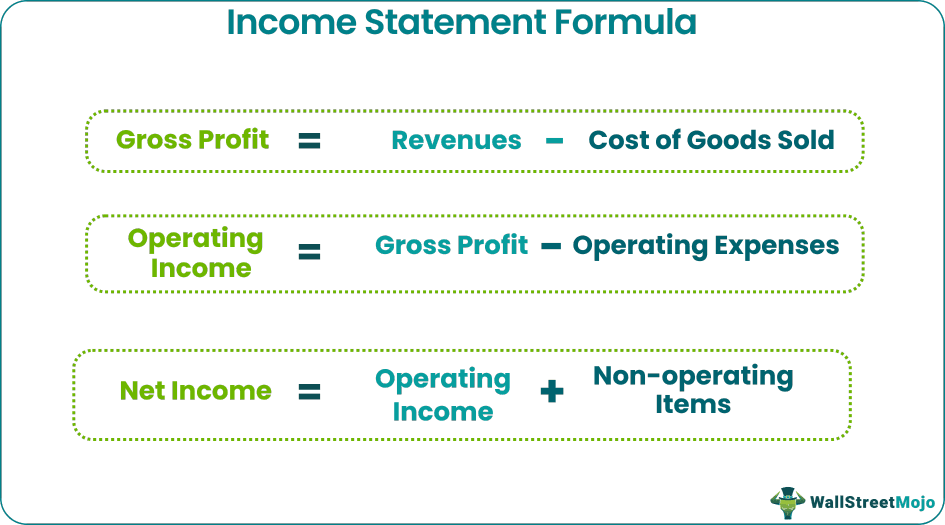
- This financial report follows the following formula:
Net Income = (Revenue-Expenses) + Gains-Losses. - Shareholders, investors, lenders, and competitors use this document for interpreting and comparing financial performance.
- It is the same as the profit and loss account that reflects the final income of a firm. However, it is entirely different from the balance sheet. A balance sheet, on the other hand, is a purview of corporate assets and liabilities.
Income Statement Explained
An income statement summarizes the performance and profitability of a business. It calculates final profit after tax by tallying revenues, expenses, gains, and losses. This document is prepared to discover areas where expenses can be controlled and more income can be generated. Thus, this data is crucial for strategizing.
No one wants to work for an enterprise that is constantly losing money; managers and executives decide to switch companies based on income statements. Similarly, lenders and banks keep a close eye on financial records to avoid loan defaults and losses.
This type of financing has its own limitations. Since these records are prepared internally, there are chances of manipulation and forgery. Further, the option of switching from one accounting policy to another provides an opportunity for manipulators. This document fails to include cash in hand. In doing so, it fails to show the ground reality. In other words, this financial statement fails to represent the actual liquidity of a company.
Video Explanation of Income Statement
Formula
Finding the net income is the purpose of drafting this report. The income statement formula is as follows:

Format
This statement records revenues, expenses, gains, and losses according to this standard format.
| Particulars | Amount | Amount |
| (A) Net Sales | - | |
| (B) Cost of Goods Sold | (-) | |
| (C) Gross Profit (A-B) | - | |
| (D) Operating Expenses (Salary, rent, commission insurance, etc.) | (-) | |
| (E) Net Income from Operations (C-D) | - | |
| (F) Other Income (Commission, interest received, rent received, etc.) | - | |
| (G) Other Expenses | (-) | |
| (H) Earnings Before Income Tax (E+F-G) | - | |
| (I) Income Tax | (-) | |
| (J) Net Profit / Net Income (H-I) | - |
Structure - Components of an Income Statement
The format focuses on the following metrics.
- Net Sales: It is the sum of a company's gross sales minus its returns, allowances, and discounts. This is the starting point for every income report.
- Cost of Goods Sold: The cost of goods sold is the amount paid for the sold merchandise or the cost of manufacturing. It is computed by deducting closing stock from the aggregate value of the opening stock, net purchases, and freight charges paid.
- Gross Profit: Gross Profit is what we get after subtracting the cost of goods sold from net sales. This is before subtracting interests, overheads, taxes, and payroll.
- Operating Expenses: This section comprises administrative expenses in a particular accounting period. It includes rent, salary, electricity, insurance, conveyance, and commission. Planning costs ahead is crucial for businesses, as this is one area that drains profits.
- Net Income from Operations: The net operating income is the difference between gross margin and operating expenses. It represents the income from a company's regular or main business.
- Other Income: The company can generate revenues from other sources as well. This includes rent, commission, and interest. All this cash inflow gets added to net income from operations.
- Other Expenses: Firms incur other non-operating expenses such as interest paid on borrowings and depreciation. These are subtracted from net operating income.
- Earnings Before Income Tax (EBIT): Other income is added to net operating income, and other expenses are subtracted. EBIT is considered the company's future earnings indicator and hence closely monitored by financial analysts.
- Income Tax: Tax payable is deducted from the EBIT to acquire net income.
- Net Profit: In order to determine net income or profit after tax (PAT), operating expenses are deducted from the gross margin, then other revenues are added to it, subsequently costs and income tax is deducted. It is called the bottom line of the income statement as it represents the final result of the business activities.
Sample Income Statement
Now that we have gone through the format and structure of the income statement let us see some examples to understand its application. ABC Inc. is a hypothetical institution operating in New York. This is their financial statement for the financial year 2020-21:
ABC Inc.
Income Statement
(Year ends March 31, 2021)
| Particulars | Amount ($) | Amount ($) |
| Sales | 975000 | |
| (-) Sales Return | (4100) | |
| (-) Sales Discount | (48750) | |
| (A) Net Sales | 922150 | 922150 |
| Opening Stock | 411000 | |
| + Net Cost of Purchased Goods | 360000 | |
| (-) Purchase Return and Allowance | (20000) | |
| (-) Purchase Discount | (17000) | |
| Net Purchases | 323000 | |
| + Freight Inward | 1500 | |
| (-) Closing Stock | (235000) | |
| (B) Cost of Goods Sold | 500500 | (500500) |
| (C) Gross Profit (A-B) | 421650 | |
| Rent | 48000 | |
| Salary | 53000 | |
| Commission | 12500 | |
| Electricity Bill | 18600 | |
| Insurance | 2000 | |
| (D) Operating Expenses | 134100 | (134100) |
| (E) Net Income from Operations (C-D) | 287550 | |
| Interest Received on Investments | 144000 | |
| Rent Received on Sub-letting Premises | 7200 | |
| (F) Other Income | 151200 | 151200 |
| Interest Paid on Loan | 126000 | |
| (G) Other Expenses | 126000 | (126000) |
| (H) Earnings Before Income Tax (E+F-G) | 312750 | |
| (I) Income Tax (21%) | (65677.5) | |
| (J) Net Profit / Net Income (H-I) | 247072.5 |
Thus, we can say that ABC Inc. generated $247072.5 in profits after tax for the financial year 2020-21.
How to Read Income Statement?
Given below is an example of Colgate-Palmolive company.

- First, the statement shows you how much revenue a company has earned over the years. Revenue represents total sales over the period (Total Sales = Units * Price per Unit). Therefore, Colgate's Revenue for 2015 was $16,034 million.
- The statement format shows "costs and expenses" incurred during the year. These costs can directly or indirectly affect the revenue of the company. For 2015, Colgate's Cost of Sales was $6,635 million.
- Revenue and costs are compared. The financial statement provides a comparative analysis of what matters. The statement shows net profit earned, if any, or net loss. In 2015, the net income for Colgate was $1,384 million.
- The structure of the statement also includes Earnings Per Share (EPS) of the company. The calculation determines the price of each share, assuming all net earnings are distributed among shareholders. Practically though, a firm never distributes all its earnings. Significant portions are reinvested into the company. This is called "plowing back of profits. Colgate's basic earnings per share were $1.53.
- According to the Securities and Exchange Commission (SEC), these statements are “a set of stairs." The idea is to look at the revenue and cost one by one. First, we look at the revenue, then the costs. Costs, directly and indirectly, affect sales. And then, one takes the stairs to account for interest and taxes. Ultimately, we are left with net profits or losses.
- Net profit or net loss is called "the bottom line." It represents how much a company earned and lost during an accounting period. As a convention, investors start from the top and make their way to the bottom line (the net profit or net loss).

Frequently Asked Questions (FAQs)
It is a financial record that a business maintains. The firms enter, track and analyze their revenues, expenses, gains, and losses. The final output is the firm's profit after tax for the given accounting period.
Following are the basic steps:
1. Ascertain the reporting period, whether it's monthly, quarterly, or annually.
2. Get the relevant final figures of various expenses, stock, income, etc., from the Trial Balance.
3. Evaluate net revenue, cost of goods sold, and gross profit by putting these values in the standard format.
4. Figure out the net income from operations by deducting all operating expenses from gross margin.
5. Now, subtract the other expenses and add other income to this net operating income to get the EBIT.
6. Finally, deduct the income tax from the EBIT to acquire profit after tax.
Both are the same since both provide figures of a company's profit or loss in a given accounting period.
Recommended Articles
This article has been a guide to an Income Statement and its Definition. Here we explain how to read the income statement along with its sample and structures. You may learn more about accounting from the following articles –
