What Is Cash Flow From Operations Ratio?
Cash Flow from Operations Ratio is the ratio that helps in measuring the adequacy of the cash which are generated by the operating activities that can cover its current liabilities and it is calculated by dividing the cash flows from the operations of the company with its total current liabilities.
The ratio interpretation will greatly depend on the industry, the entity’s size and the nature of its operations. But generally, a higher value will indicate a good level of cash flow to meet its operational needs, which is extremely important to keep the business running smoothly and in good financial health.
Key Takeaways
- The cash flow from operations ratio determines the cash sufficiency created by the operating activities that can make up the current liabilities. It is calculated by dividing the cash flows from the company’s operations by its current liabilities.
- Cash flow from operations involves cash from the company’s prime business operations.
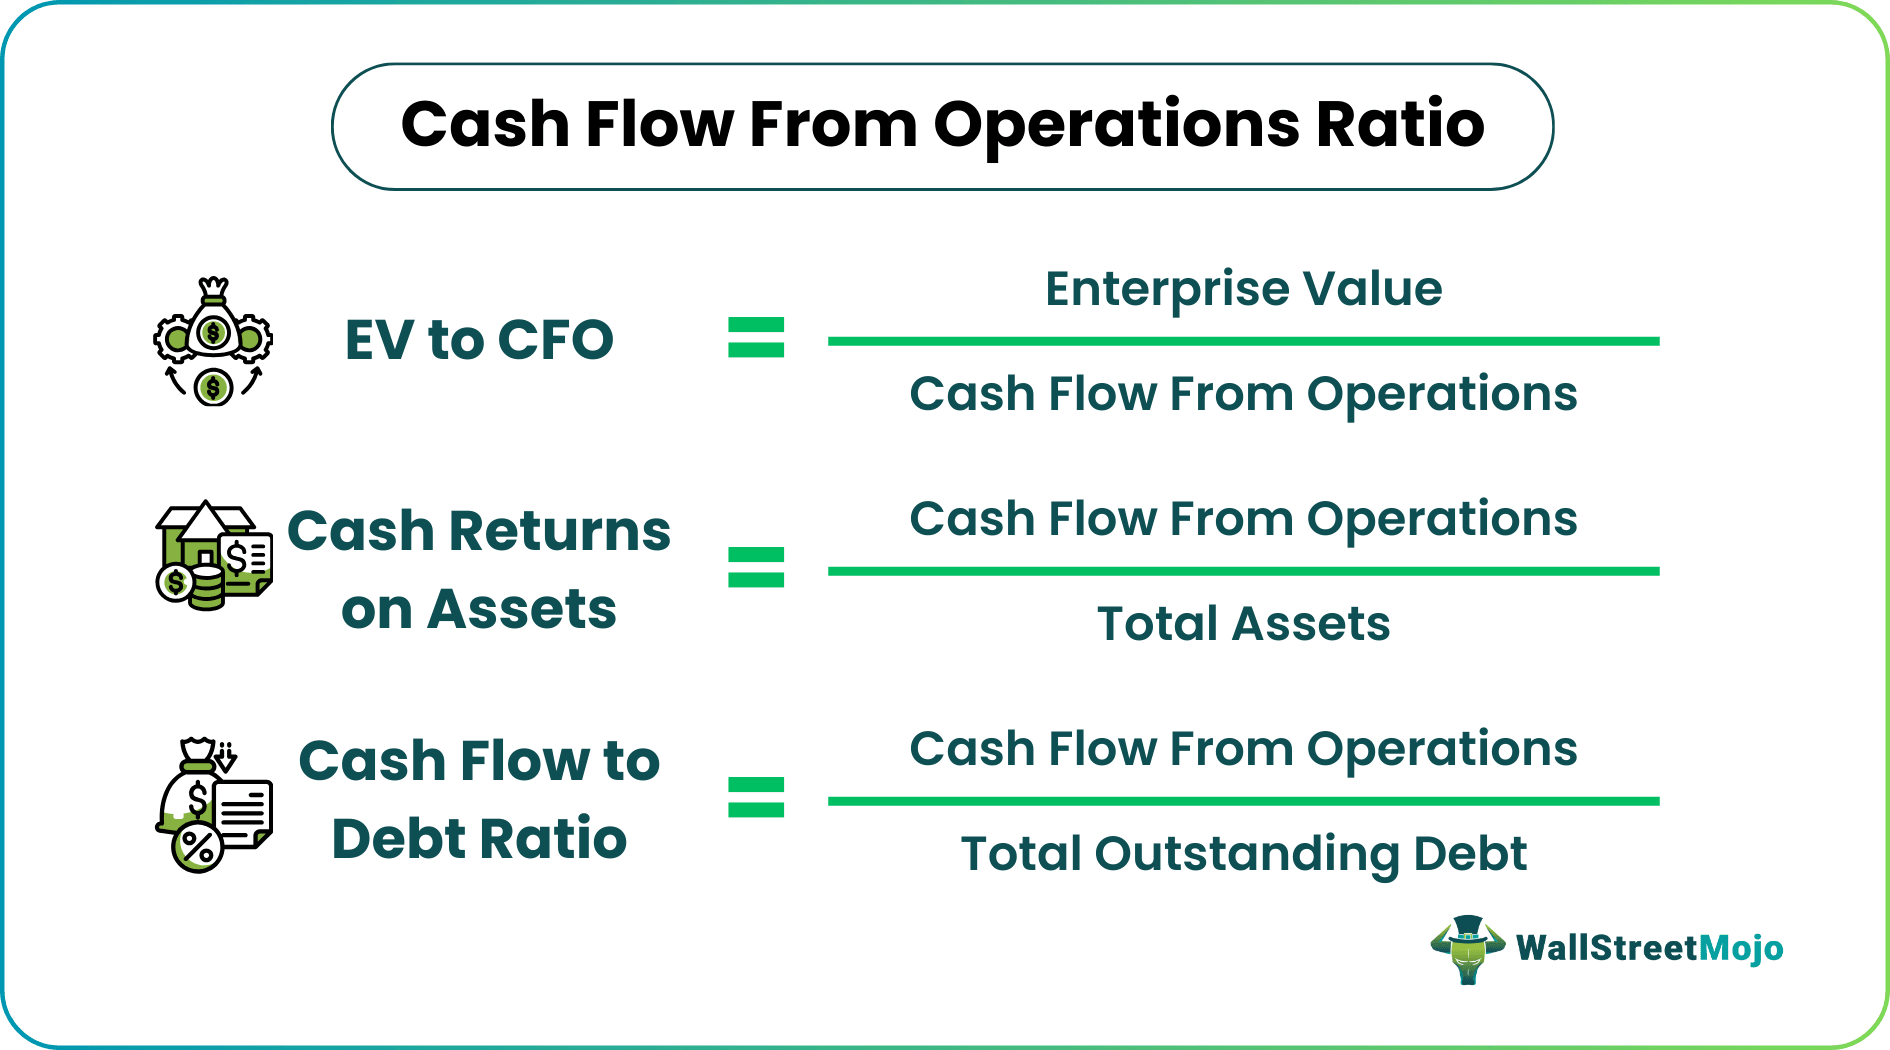
- The cash flow formula from the ratio of the operation is
EV to CFO= Enterprise Value/Cash Flow from Operations,
Cash Returns on Assets= Cash Flow from Operations/Total Assets, and
Cash Flow to Debt Ratio=Cash Flow from Operations/ Total Outstanding Debt.
Cash Flow from Operations Ratio Explained
The cash flow from operations ratio is a metric that is widely used in the financial market that helps the management, investors and other stakeholders of the organization to evaluate its ability to generate cash for the business. It is the main source of fund needed to meet the operational expenses of its core activities.
The cash flow from operations ratio formula is an important metric that is commonly used to assess the liquidity and financial condition of the business. A strong cash flow is necessary so that the operations can run smoothly and daily expenses are met without any hindrance. This also makes way for creating a good and healthy work process between various departments of the company and its vendors or customers.
A high cash flow, which is consistent and increasing, is always desirable for the company because it is a positive sign, indicating strong balance sheet, high sales, revenue and good control over its cost. It also shows that the business is able to manage the various risks involved in the process efficiently. In this article, we will study the different ratios commonly used in the business process for calculation of the same.
Explanation Of Cash Flow From Operations In Video

Formula
Let us look at the different cash flow from operations ratio formula used to calculate the ratio in various ways.
#1 – CFO Enterprise Multiple
EV to CFO Formula is represented as follows,
Another more popular and precise formula:
- Enterprise value, in simple terms, is the current market value of the firm. It identifies the opportunity cost of the business at the current point of time. It is the sum of all assets and liabilities that the firm is entitled to. It’s a very dynamic value and can vary a lot with time.
- It is often confused with the market capitalization of listed companies, which only reflects the value of common equity. Because of the comprehensive worth that it provides, enterprise value is often the replacement for total Enterprise value.
- Cash flow from operations includes cash from primary business operations of the company.
Interpretation
- CFO enterprise multiple helps in calculating the number of years the firm will take to buy its entire business using the cash flow generated from the core business activities of the firm. In simple terms, how much time the firm will take to repay all debt and other liabilities by using the operations cash flow without putting any restraint on the assets of the firm. This analysis is helpful in mergers and acquisitions.
- This metric is very helpful for investors comparing firms operating in a similar business. The lower the ratio, the more attractive is the firm for investment.
#2 – Cash Returns on Asset Ratio
Cash Returns on Asset Formula is represented as follows,
- Total Assets includes all assets and not just limited to the fixed assets and can be calculated directly from the balance sheet.
Interpretation
- Cash returns on asset ratio is an essential metric in capital intensive firms. It helps in evaluating the financial condition of the firm, which large investments in assets like setting up manufacturing plants and workshops, buying raw materials as these large investments, owing to the large value per transaction, can alter the financial statements to a great extent.
- It is an important metric to identify the investment opportunity and comparing firms operating in similar businesses. In general, a higher ratio is better when analyzing the capital intensive firms like automakers or real estate firms.
- Last but the most crucial attribute of this metric is that it helps in identifying how efficiently the firm is employing its assets. A higher value may convince the investors that the firm has good operational efficiency and may continue to grow at a good pace, eventually giving better returns to its shareholders.
#3 – Cash Flow to Debt Ratio
Cash Flow to Debt Ratio Formula is represented as follows,
- Total debt calculated from the balance sheet
Interpretation
- Although fairly unrealistic and impractical for the management of a firm to use all its operating cash flows to repay the outstanding debt, the cash flow to debt ratio provides a critical metric in analyzing the firm’s financial status. It provides a snapshot of how much time a firm will take to repay all its debt using its operating activities – hence providing an important instrument in identifying the return on investment for both shareholders and other firms looking to acquire it.
- In addition to identifying the growth opportunities, it also helps the investors in identifying if the firm is highly leveraged or not. This measure can be helpful for risk-averse investors in making investment decisions.
#4 – Capital Expenditure Ratio
Often termed as CF to CAPEX ratio, the capital expenditure ratio measures a firm’s ability to buy its long-term assets using the cash flow generated from the core activities of the business.
The Capital Expenditure Ratio Formula is represented as follows,
- Capital spent by management on building long term assets of the firm;
Interpretation
- The capital expenditure ratio is an essential metric for fundamental analysts as it helps find if the firm is undervalued or overvalued. Rather than being used as an individual ratio, it is primarily used to compare similar firms in an economy.
- This metric is also crucial for the management as it helps them identify where exactly the firm’s cash flows are going. Knowing this data, management can strategize for the future and devote its attention to evaluating capital-intensive projects like setting up a new office or expanding a production facility, launching a new set of products, or restructuring the operational setup.
Examples
Let us understand the concept with the help of some suitable examples.
Example #1
Let’s consider a firm with the following financials.

Using the above numbers, let’s calculate CFO enterprise multiple using the above equations
((10,000,000 * 50) + 500,000 – 300,000) / 50,000,000
EV/CFO = 10.004
Examples #2
Let’s consider the example of an automaker with the following financials.

Cash returns on assets = cash flow from operations/ Total assets
= 500,000 $/ 100,000 $
Cash Returns on Asset Ratio = 5
It means that the automaker generates a cash flow of 5$ on every 1$ of its assets. Comparing it with other automakers in the economy, an investor can identify the firm’s growth prospects.
Example #3
Let’s continue with our previous example of the automaker with the following financials.

Using the above formula, cash flow to debt ratio = 500,000/2,000,000
Cash Flow to Debt Ratio = .25 or 25%
Frequently Asked Questions (FAQs)
Why is cash flow from operations ratio important?
Operating cash flow is essential as it analyses the economic progress of a company’s core business activities. In addition, it determines the money generated by the regular business work.
What is a good cash flow from operations ratio?
A good cash flow from operations ratio varies depending on the industry and company. Generally, a ratio greater than 1 indicates the company has positive cash flow from operations, while less than 1 shows negative cash flow.
How can a company improve its cash flow from operations ratio?
A company can improve its operation ratio by increasing its revenue, reducing operating expenses, efficiently managing its working capital, and optimizing its cash flow management process.
Recommended Articles
This article has been a guide to what is Cash Flow from Operations Ratio. We explain its various formula along with some suitable examples. You may learn more about finance from the following articles –