What is Cash Flow Per Share (CFPS)?
Cash Flow per Share of the company shows the cash flow portion of the company, which is allocated against each of the common stock presented in the company. It is calculated by dividing the cash flow which the company earns during an accounting period by total outstanding common stock.
Key Takeaways
- Cash flow per share of the company displays the company’s cash flow portion, given against each common stock. It can be calculated by dividing the company’s cash flow by the total outstanding common stock in an accounting period.
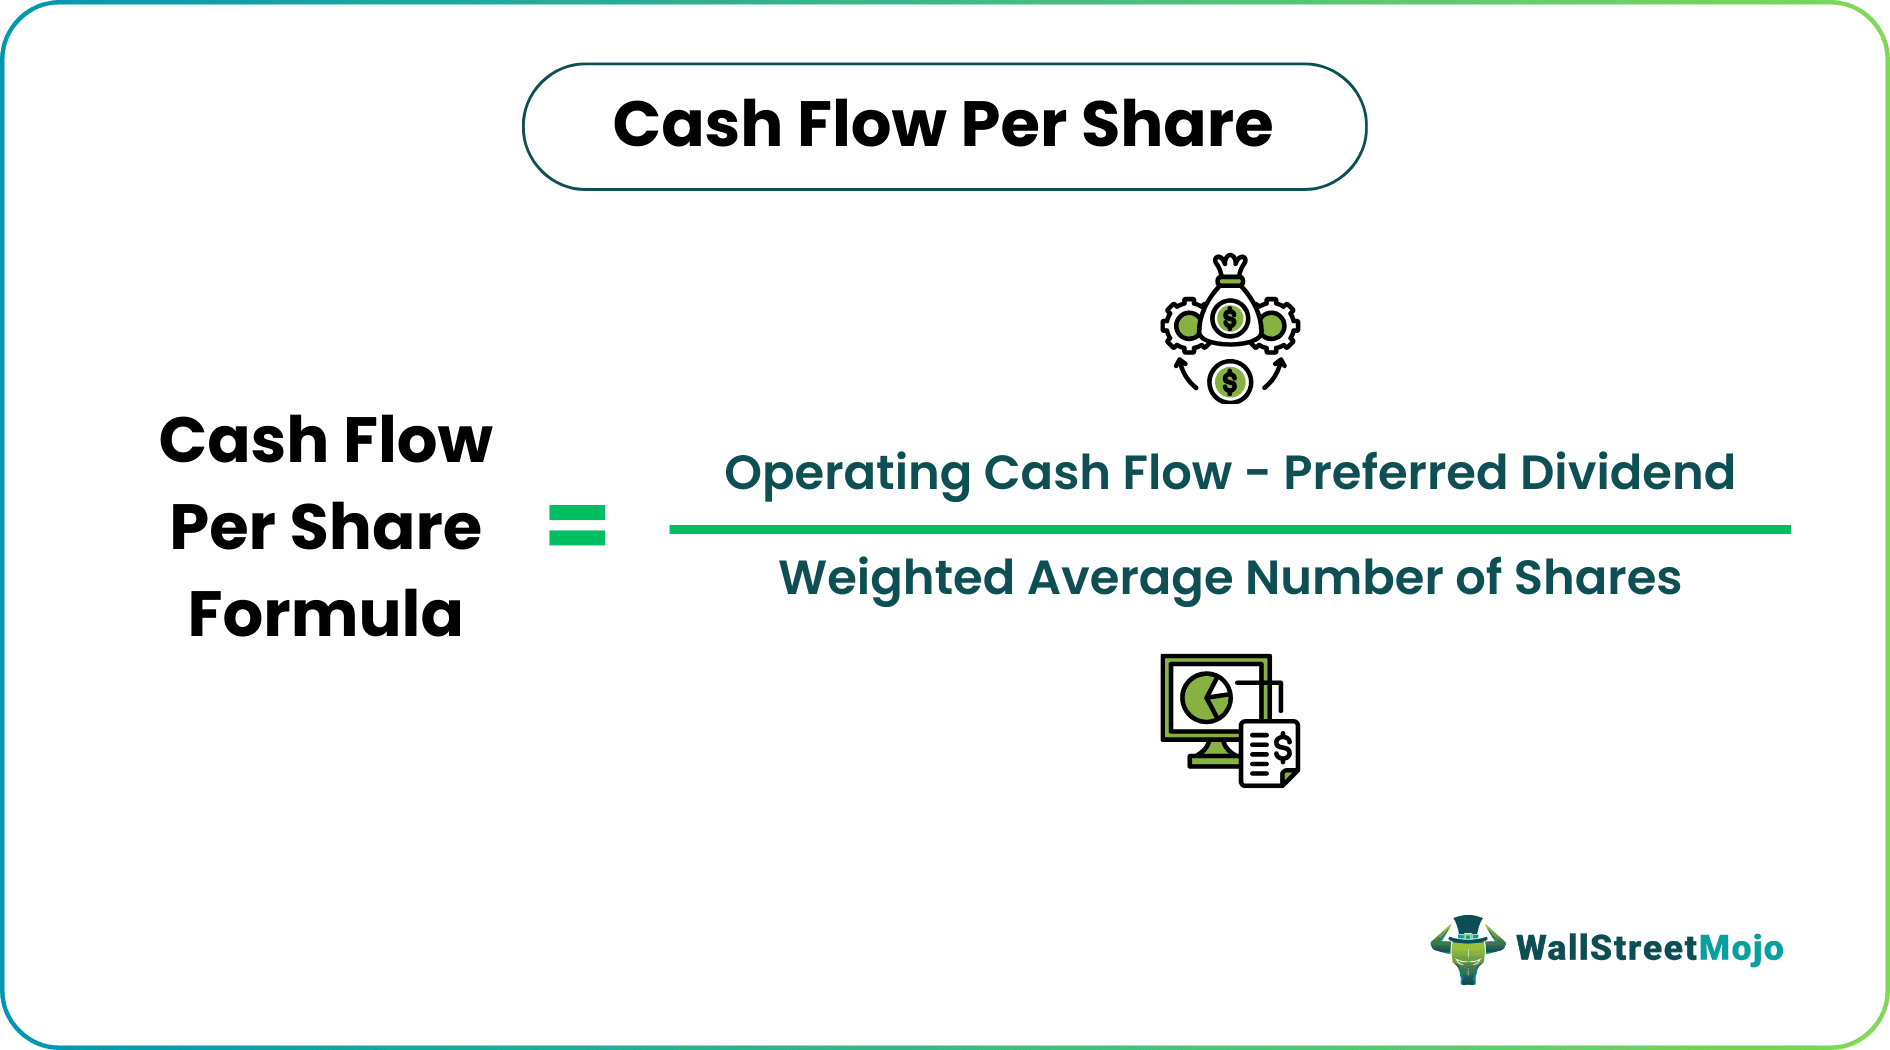
- It is evaluated as a ratio that divides the cash flows created under regular business workings after adjusting for preferred dividends in a reporting period by the total outstanding shares or the weighted average number of shares.
- Investors may also analyze cash flow statements and compute financial ratios such as Cash Flow Per Share other than EPS or P/E ratio.
How to Calculate Cash Flow Per Share?
Cash flow per share can be calculated as a ratio that divides the cash flows generated under normal business operations after adjusting for preferred dividends during a reporting period (yearly, semi-annually, or quarterly) by the total number of shares outstanding or the weighted average number of shares. A weighted average number is generally used because the number of outstanding common shares can fluctuate over the given period.
It can also be calculated using net income or EBIT (earnings before interest and taxes) by adding back the cost of depreciation and amortization to EBIT, which are non-cash transactions and do not involve actual cash flows from operations by any outflow.
Examples
Example #1
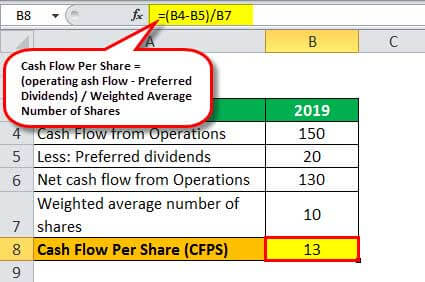
Mr. Unknown of Ethical analytics has to calculate the Cash Flow Per Share (CFPS) of Hypothetical Pvt. Ltd using the following data extracted from the financial statements of the company:-

Calculation of Weighted Average Number of Shares
For 2018 8-lakh shares for a full year and 2-lakh shares for a half-year
=8+2*6/12 =9 Lakh
For 2019 10-lakh shares for the full year
=10*12/12=10 Lakh
Therefore, the Calculation of CFPS for 2019 is-
Similarly, we have done the calculation of CFPS for 2018

Example #2
Ethical analytics again tasked Mr. Unknown to calculate the Cash Flow Per Share (CFPS) of another company XYZ Pvt. Ltd. But this time, data from cash flows statements are not available but are available from the income statement as given below:-

Solution:
Calculate CFPS for 2019 using below formula

- Cash Flow per Share Formula = (EBIT * (1 – tax rate) + Depreciation) / Common Shares Outstanding
- =(120*(1-36%)+40)/10
- =11.68
Similarly, we have done the calculation of CFPS for 2018

- = (100*(1-30%)+20)/9
- =10
Video Explanation Of Cash Flow

Why is Cash Flow Per Share Better than EPS?
EPS or Earnings per Share is the most popular profitability metric used by investors and analysts to measure the number of profits allocated to its equity (common) shareholders. It is calculated by dividing its net income or EAES (earnings available to equity shareholders) by the weighted average number of outstanding shares.
EBIT or net income is calculated after the company generates revenues (sales). Often, sales are made on credit, i.e., zero cash inflow, but it increases the company’s earnings. Also, EBIT is calculated after deducting the cost of depreciation and amortization (non-cash expenses), and additionally, net income will be calculated after subtracting various non-recurring and irregular expenses.
All these factors can deflate the value of net income artificially. Also, EPS can be easily manipulated through liberal accounting practices.
This example will try to justify the popular quote about cash flows: “Cash is the King.”
Kingsman Pvt. Ltd has an innovative product with low production costs and expected high demands. With high enthusiasm, they invest heavily in setting up a production line, building warehouses, and marketing their product. The company issued 100,000 equity shares at 10 per share to meet all of its expenses.
The demand was high as expected, but the new players generated most of their sales on credit. And due to the low cost of depreciation, the profit (net income) figure appears huge initially. But later, the company starts lacking the availability of cash in its hands. The company now has to lower its production capacity, cut its costs, or apply for some loan, which further has costs.
The company’s income statement for the first quarter is as follows:-

EPS = Net Profit / Number of shares outstanding = 490 / 100 = 4.9
The Net Profit values are huge, and the EPS ratio is quite good, but a crisis for cash arrives at the company.
The company’s management must have checked the cash flow statements and calculated a more reliable profitability ratio of CFPS.
Operating Cash Flow = Operating Cash Inflow – Operating Cash Outflow
= 500 – (280+210) = 10
So the calculation of CFPS is as follows,
Cash flow per share formula = Operating Cash Flow / No. of shares outstanding
= 10 / 100
= 0.1
The Kingsman, if tracked its cash flows earlier, would have known its poor cash collection performance and would have avoided the situation of crisis. High EPS indicates the expected earnings the shareholders may get in the form of dividends for every share they hold. CFPS shows the actual cash flow carried by the Kingsman during the quarter.
Conclusion
- EPS is an important profitability metric, but CFPS should never be overlooked.
- Earnings can be manipulated, but cash flows present the true picture. Hence in finance and accounting, it is said that “Cash is the King.”
- To a certain extent, every company manipulates some numbers to increase or decrease their profit values. E.g. services to be provided over the next three years, the company recorded a lump-sum amount of all three years as revenue in the current year itself and inflated the overall value. a company should have distributed the revenue in all three years or record as and when received.
- Companies show assets worth billions in their books but never exist and charge heavy depreciation to lower their profit figures to pay fewer taxes. Classic examples are companies like Enron, Worldcom, Adelphia. Their Balance sheet looks extremely impressive and justifies the low-profit figures due to high depreciation costs. Such extreme manipulation enters the category of fraud.
- Investors must also study cash flow statements and calculate financial ratios like CFPS other than EPS or P/E ratio.
Frequently Asked Questions (FAQs)
Is a high cash flow per share good?
The surging free cash flow to outstanding shares value is good since the company is considered to have better probability and more economic and operational flexibility. Thus, free cash flow per share is also known as free cash flow for the company.
What is a good cash flow per share ratio?
The higher ratio is favored by investors, creditors, and analysts as more than 1.0, meaning a company may make up the current short-term liabilities. Yet, earnings may be left after clearing the liabilities
Can cash flow per share be negative?
Yes, the cash flow per share can be negative. However, this occurs when a company’s cash flow from operations is negative and significant outstanding shares exist. A negative cash flow per share indicates that the company is experiencing financial difficulties and may have trouble meeting its financial obligations.
Recommended Articles
This article has been a guide to Cash Flow Per Share and its definition. Here we discuss how to calculate Cash Flow Per Share and practical examples. We also discuss the difference between CFPS vs. EPS. You can learn more about accounting from the following articles –