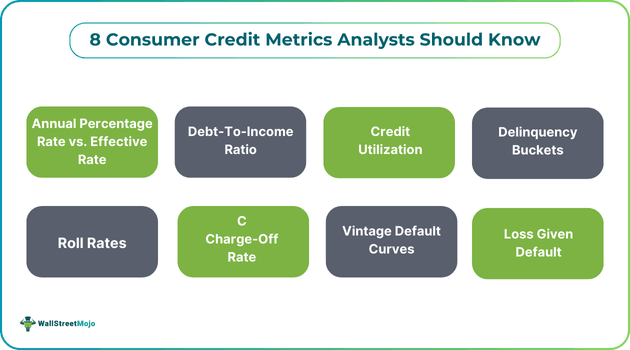
8 Consumer Credit Metrics Analysts Should Know
Table of Contents
Introduction
The money lent by financial institutions or other lenders helps borrowers fulfill their financial requirements and achieve different goals, for example, funding the purchase of a new home or a car. Having said that, each time financial assistance is offered, lenders must ask themselves an important question before sanctioning the loan: Is the borrower capable of repaying the debt within the specified time?
While it requires a straightforward answer (yes or no), figuring out that answer requires the help of analysts who consider different factors to find out whether the applicant is creditworthy and gauge the possibility of losses.
If you are wondering what these factors are, you have come to the right place. These factors are basically consumer credit metrics, and mastering them is not just about the calculation part. It is about sharpening foresight, reducing financial risk, and translating raw data into clear, strategic action. Keep reading to learn about these key financial metrics in detail.
1. Annual Percentage Rate (APR) vs. Effective Rate
Formula:
- APR = Stated Interest Rate + Fees (Annualized)
- Effective rate = (1 + Periodic Rate)^n – 1, where n is the number of compounding periods per year
Why It Matters: APR plays a key role in helping a consumer compare products across lenders. That said, analysts often require the effective rate to determine the true cost of borrowing. For revolving credit or products associated with frequent compounding, the effective rate can deviate sharply from APR, giving a better sense of actual repayment burdens.
Analyst Tip: Always check the effective rate when modeling repayment risk. A borrower carrying balances on a card at 19.9% APR could, in practice, be paying over 21% once compounding is taken into account.
2. Debt-To-Income Ratio
Formula:
DTI = (Monthly Debt Payments ÷ Gross Monthly Income) × 100
- Why It Matters: DTI is an important metric that indicates to an analyst whether a borrower’s income can realistically support their debt load. Lenders often set the DTI limits for approvals, but analysts monitor the average DTI of borrowers to project delinquency trends.
- BNPL Context: A discretionary purchase like a new gaming console may appear small in isolation. That said, if the purchase is financed via installment plans, it pushes up the recurring obligations. Consider how a PS5 Buy Now, Pay Later plan might impact a household that is already managing car loans and student debt. Even minor BNPL commitments can compound repayment risk when added to other obligations.
- Analyst Tip: When assessing DTI in a portfolio, analysts have to consider both reported installment obligations and unreported BNPL liabilities that may not surface in conventional data provided by credit bureaus like CRISIL, Equifax, etc.
3. Credit Utilization
Formula:
Credit Utilization = (Outstanding Balance ÷ Total Available Credit) × 100
- Why It Matters: High credit utilization is a strong predictor of future delinquency. A borrower consistently using 70% or more of available credit may be living at the edge of financial stability.
- BNPL Context: While BNPL balances often fall outside credit bureau data, some organizations are beginning to report utilization. Analysts need to account for these balances because they function like short-term credit lines.
- Analyst Tip: Assess credit utilization across both individual accounts and aggregate borrower profiles. A credit card holder at 50% credit utilization on three accounts represents a higher risk than a borrower at 50% credit utilization on one account.
4. Delinquency Buckets
Categories:
- 30–59 Days past the due date
- 60–89 Days past the due date
- 90+ Days past the due date
Why it matters: These buckets provide a standardized way to track repayment deterioration for credit analysts. Early-stage delinquencies often serve as a leading indicator for charge-offs six months later.
Analyst Tip: Segment delinquency by product type. BNPL delinquencies can accelerate faster than traditional credit cards, particularly if installments are biweekly, rather than monthly.
5. Roll Rates
Formula:
Roll Rate = (The Balance Moving from One Delinquency Bucket to the Next ÷ Total Balance in the Prior Bucket) × 100
- Why It Matters: Roll rates quantify how accounts transition between delinquency stages. A 20% roll rate from 30 to 59 days to 60 to 89 days shows that one in five borrowers did not catch up.
- Analyst tip: Compare roll rates across cohorts. A sharp increase in BNPL roll rates during holiday seasons may highlight consumer overextension. In the case of credit cards, rising roll rates often precede an uptick in charge-offs.
6. Charge-Off Rate
Formula:
Charge-Off Rate = (Total Charge-Offs ÷ Average Outstanding Balances) × 100
- Why It Matters: Charge-offs mark the point where lenders formally recognize a loan as uncollectible. This metric has a direct impact on profitability and regulatory reporting.
- Analyst Tip: Look beyond the headline number. A stable charge-off rate may mask concentration in certain demographics or regions. Segmenting charge-offs by origination vintage, product type, or income band reveals underlying vulnerabilities.
7. Vintage Default Curves
- Definition: Vintage analysis groups accounts on the basis of origination period and monitors default rates over time. This creates curves that show repayment performance across cohorts.
- Why It Matters: Vintage curves highlight the shifts in the quality of underwriting. A steeper curve in recent cohorts indicates lending standards have loosened or macroeconomic pressures have worsened.
- Analyst Tip: Use vintage curves to carry out the comparison of BNPL originations on a year-over-year or YOY basis. If defaults increase faster in the most recent vintage, it may indicate weaker borrower screening or broader economic stress.
8. Loss Given Default (LGD)
Formula:
LGD = (Exposure At Default – Recovery) ÷ Exposure At Default
- Why It Matters: LGD shows how much lenders lose after defaults, net of recoveries. For unsecured credit, LGD often nears 100%, but collections strategies and legal frameworks can minimize losses.
- Analyst Tip: Pair LGD with charge-off and roll rate data. High roll rates in combination with elevated LGD are signs of both worsening borrower behavior and limited recovery capacity.
Use These Metrics Today
The above eight consumer credit metrics give analysts the foundation to carry out the assessment of individual borrowers and entire loan portfolios.
Analysts who master these measures will be better positioned to anticipate the shifts in credit risk, allocate provisions effectively, and advise on lending strategies that balance growth with resilience.
