Earnings Estimate Meaning
An earnings estimate is the projection of a company’s earnings by analysts for a given period, which can be quarterly, semi-annually, or annually. It is considered the most important factor in determining its future share price. Future projects, cash flows, market conditions, and several other factors are taken into consideration in calculating this estimate.
Earnings estimate data is often researched and published by analysts at investment banking firms. They analyze a particular stock and forecast its future performance. Moreover, the cash flow of the company can also be determined by the estimate. This gives a clearer understanding of the company’s financial well-being as well.
Key Takeaways
- Earnings estimates are projections made by analysts regarding a company’s earnings for a specific period, and they play a crucial role in determining its future share price.
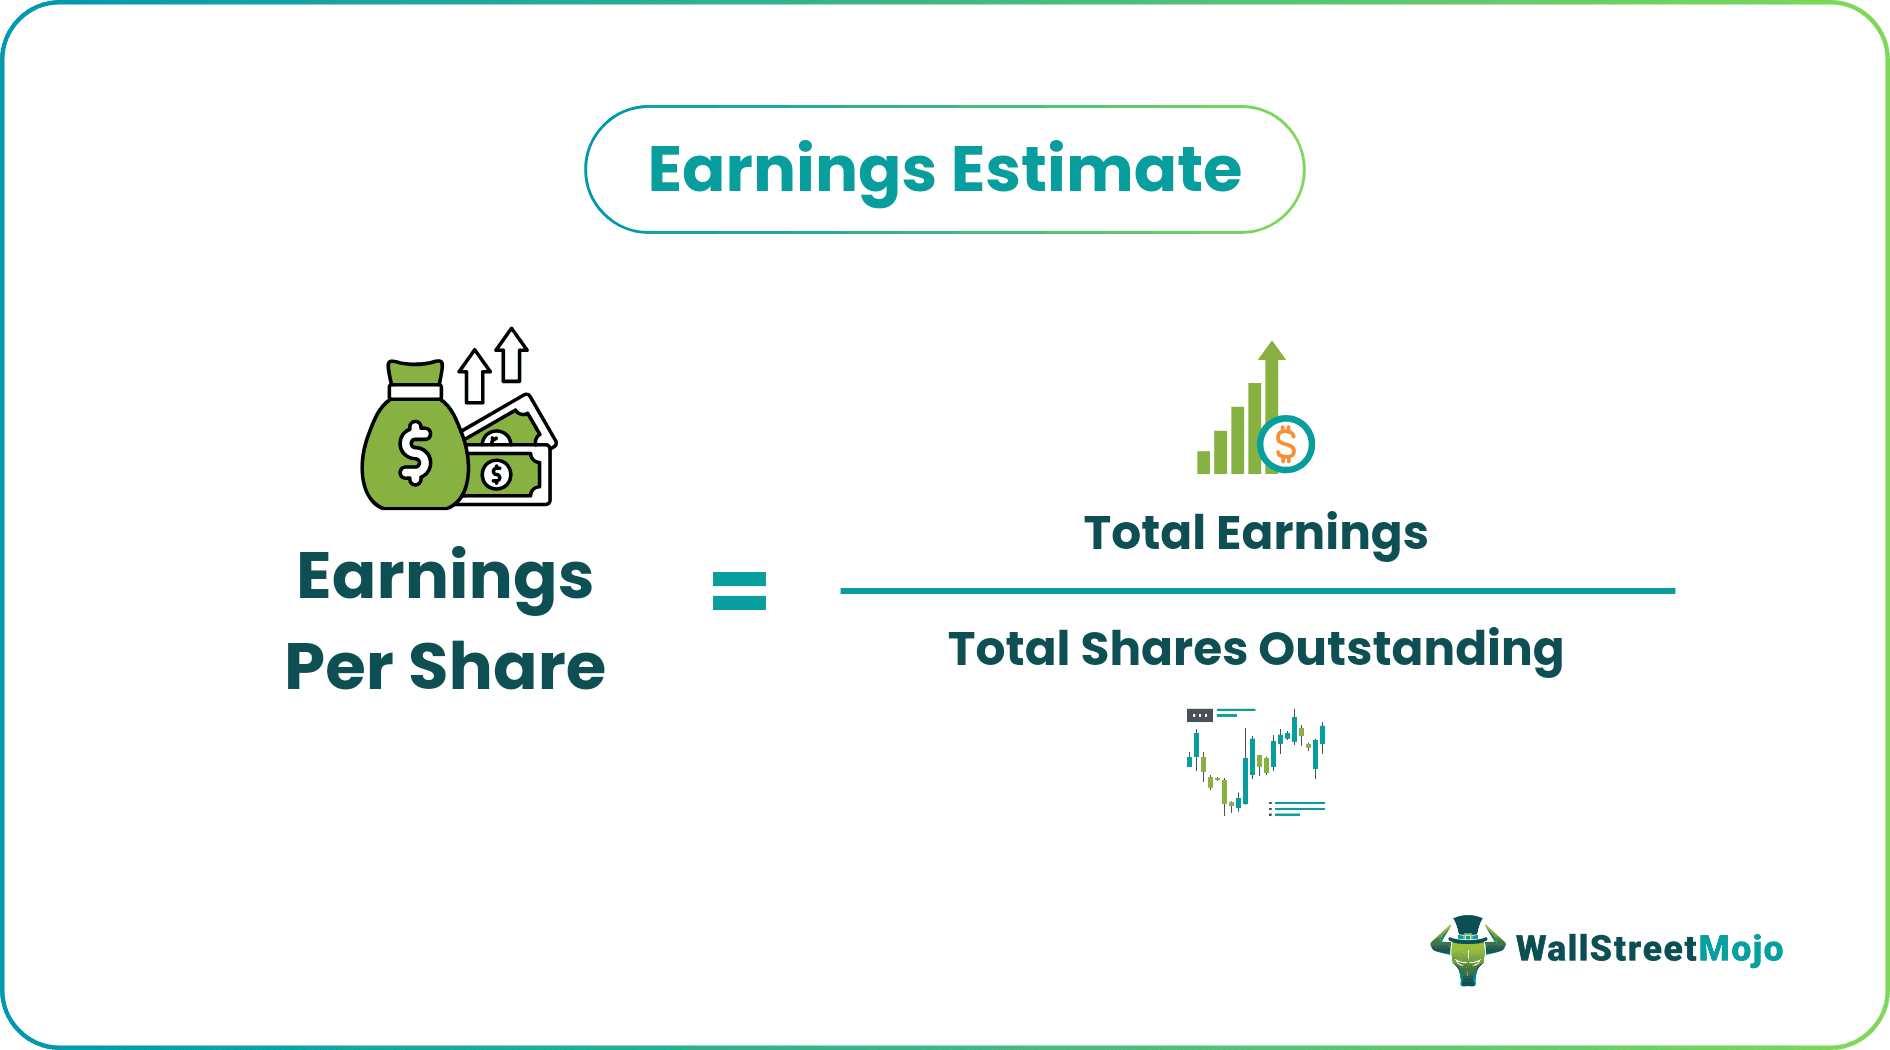
- Earnings per share (EPS) estimation is a commonly used metric to assess a company’s profitability, calculated by dividing total earnings by the total number of shares outstanding.
- Analysts consider various factors, such as historical data, market conditions, and product-specific considerations, to estimate the revenue for each product line and subsequently calculate the overall earnings for the company.
- Beating earnings estimates can help enhance a company’s reputation and investor confidence, contributing to long-term growth and shareholder value.
Earnings Estimate Explained
Earnings estimate is the approximation of a company’s earnings per share (EPS) for a quarter or a fiscal year. It helps in determining the share price. It is always good for a company to beat the earnings estimate as it helps build a reputation for the company in the long run.
Analysts from investment banking firms, conduct the analysis to deliver the data on the management and performance of the company. Investors and traders often make decisions about a particular stock based on the commentary on these companies.
However, since it is only an approximation, earnings estimate revisions are also made based on new developments in terms of products, services, new deals, and growth in the company’s prospects.
Revenue vs. Earnings Video Explanation

How To Calculate?
Let us understand how to calculate a set of earnings estimate data through the detailed explanation below.
The market usually does not want to see a company’s total earnings for the share price estimation. Therefore, the most useful data is EPS estimation.
Earnings Per Share = Total Earnings / Total Shares Outstanding
Examples
Let us understand the concept of estimates of EPS and earnings estimate revisions with the help of a couple of examples.
Example #1
ABC Co. has 5 product lines. The revenue from each product line from the last quarter is given below: –
- Product Line A: $5 million (seasonal product, the season starts from January to June)
- Product line B: $3 million (seasonal product, starts from July to December)
- Product line C: $4 million (luxury product)
- Product line D: $8 million (Fast Moving Consumer Goods – FMCGs)
- Product line E: $2 million (car production)
What factors may an analyst consider and estimate the EPS for the next quarter from July to September? In addition, the total shares outstanding in the market is 10 million.
Solution:
There are several factors that an analyst should consider to calculate earnings per share for the next quarter. First, the analyst must study each product line very carefully.
Product Line A
It is a seasonal product. We see that its season just ended. Hence, the last quarter, April – June, earned the company $5 million in revenue. So, it is expected that the revenue may not be the same from this product line this quarter as it is seasonal and just ended. Therefore, the analyst may have to see the past 5 to 10 years’ record and analyze what was the drop in the sales for this product line after June. Say, the drop was 45% on average. So, he may have to take a call as to whether he should consider 45% or lower or higher for this year. Say for this year; he thinks the drop will even be more. So, the analyst considered a drop of 55%, i.e., -55%.
$5 million * 55% = $2.75 million.
Expected revenue from product line A for the next quarter (July to September)
- = $5 million – $2.75 million
- = $2.25 million.
Product Line B
It is also a seasonal product whose season is just about to start. So, the analyst will again view the past year’s data and see the rise in sales from July. For example, the average rise in sales from July for the past ten years is 40%. So now, the analyst may take a call as to what he should consider for this year. Say the football World Cup is scheduled to happen this quarter. This product is related to sports. So, the increase in revenue estimation should be more than 40%. Suppose the analyst considered the rise in revenue to be 50%. i.e., +50%.
$3 million * 50% = $1.5 million
Expected revenue from product Line B for the next quarter (July to September)
- = $3 million + $1.5 million
- = $4.5 million.
Product Line C
Luxury product sales depend on the purchasing capacity of the country. Therefore, to estimate the sale of a luxury product for the next quarter, the analyst will have to calculate the GDP growth rate, the quarter’s per capita income, and any financial distress for the quarter. After considering all the factors, analysts decide that the sale will drop by 10% for the next quarter, i.e. (- 10%).
$4 million * 10% = $4 lakh
Expected revenue from product line C for the next quarter (July to September)
- = $4 million – $4 lakh
- = $3.6 million.
Product Line D
Fast Moving Consumer Goods (FMCG) are sold mostly throughout the year. So, for this, the analyst can calculate the revenue by seeing the past ten years of data and seeing if any outliers are present. For example, say there was a drop in sales in a particular year due to a flood; then, the analyst will have to remove this outlier before doing the calculation if the analyst finds out that the sale of this product remains constant for the next quarter as compared to the previous quarter.
Expected revenue from product line D for the next quarter (July to September)
- = $8 million.
Product Line E
Car sales depend on many factors. The price of fuel, economic conditions, pollution control laws, availability of steel, and many others. So, the analyst should predict the movement of all the factors and then estimate the sales percentage of the car for the next quarter. For example, suppose an analyst finds out that car sales will increase by 20% for the next quarter (i.e., + 20%).
$2 million * 10% = $4 lakh
Expected revenue from product line E for the next quarter (July to September)
- = $2 million +$4 lakh
- = $2.4 million.
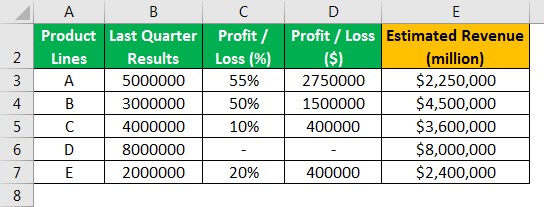
So, the total estimated revenue of ABC Co. for the next quarter can be calculated as follows: –

Revenue from product A + Revenue from product B + Revenue from product C + Revenue from product D + Revenue from product E
- = $2.25 million + $4.5 million + $3.6 million + $8 million + $2.4 million
- = $20.75 million.
Earnings Per Share = Total Earnings / Total Shares Outstanding
- = $20,750,000 / $10 million
- = $2.075
So, $2.075 is the earnings per share estimate for the next quarter.
Refer to the Excel sheet given above for detailed calculations.
Example #2
In March 2023 Zacks Equity Research, a reputed firm in the U.S., conducted an analysis on Accenture (ACN). In the last two quarters, earnings estimate revisions had to be made as ACN delivered earnings surprise as its stock was expected to grow to $2.91 per share but it rose to $3.08 per share.
Therefore, the surprise of the jump in the price of the share was over 5%. Therefore, analysts were bullish on the near-term benefits of investing in the stock. As a result, the stock maintained an upper circuit after the report was published on the official website of NASDAQ.
Earnings Surprise
Earning surprise is when the company earnings are below or above the estimated.
A positive surprise is always good for the company. A positive surprise means when the actual earnings are more than the estimated earnings.
These surprises in earnings can occur due to various factors, both internal and external to the company. Movements in the economic conditions, government policies, and trust in the company’s management could be examples of external factors that might create a positive or negative surprise in the EPS of a company.
Analysts make earnings estimate revisions based on the changes experienced in the economy or internal to the company and forecast its performance for the perusal of investors and traders alike.
Impact on Share Price
We see a share price in the market based on several factors; earnings are one among them. The present value of all the company’s future earnings reflects in the share price. So, when there is a positive earnings surprise, the earnings are more than estimated. It is calculated by the share price you see in the market with the help of estimated earnings. As the actual earnings have beaten the estimate, one must include new information in the calculation, so the share price rises.
Frequently Asked Questions (FAQs)
Why are earnings estimates important?
Earnings estimates are important because they help investors and analysts gauge a company’s financial performance and growth potential. They provide insights into future earnings and assist in evaluating investment opportunities and making informed decisions.
What is the difference between consensus estimates and earnings estimates?
Consensus estimates represent the average of all analyst predictions, providing a balanced view of expected earnings. On the other hand, earnings estimates refer to individual analyst forecasts that may vary from the consensus. Consensus estimates offer a broader perspective, while individual estimates may reflect unique insights or biases.
What is earnings surprise vs. earnings estimates?
Earnings estimates refer to analyst forecasts of a company’s expected earnings for a specific period. On the other hand, an earnings surprise occurs when a company’s actual earnings significantly differ from the consensus estimates. Positive earnings surprises indicate better-than-expected earnings, while negative surprises suggest weaker performance. Earnings surprises can impact stock prices as they influence investor perceptions of a company’s financial health and growth potential.
Recommended Articles
This article is a guide to Earnings Estimate meaning. Here, we explain how to calculate earnings per share, examples, and how it affects the share price. You can learn more about it from the following articles: –