Part of our Strategic Management & Planning guide
What Is Fishbone Diagram Template?
A Fishbone diagram is a straightforward tool that permits quick and effective tracking of root causes in pursuing corrective actions. It is also known as the cause-and-effect diagram. In other words, the Ishikawa diagram. In a Fishbone diagram template, there will be several causes, which shall group into various classes, which one shall use to highlight the causes of the potential issue.
Fishbone Diagram Template
Download Excel Template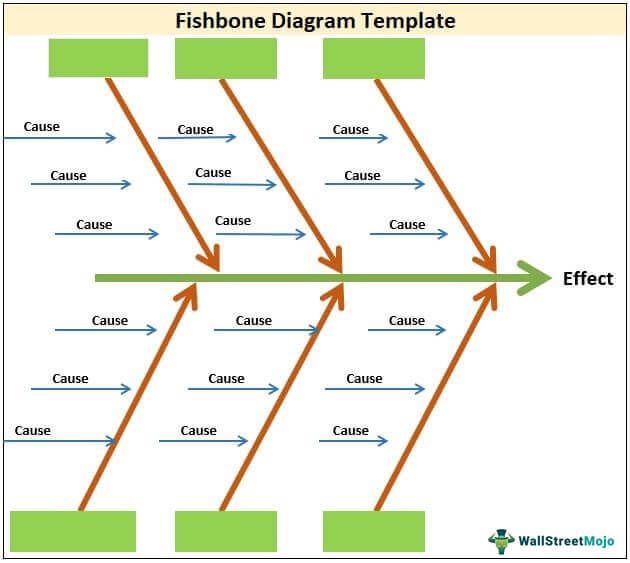
Thus, it is a method that helps the manager and their team members visually point out the reason why the problem is arising and what may be the result of it. It is a process that helps in the analysis of the root cause of a situation and initiates a session of brainstorming to find a solution so that the problem can be controlled on time.
Fishbone Diagram Template Explained
In 1968, Kaoru Ishikawa introduced it for the quality management process. Hence, the reason it’s named as Ishikawa diagram.
The main goal of this fishbone diagram is to brainstorm all the kinds of potential causes that shall cause the obstacle and then get deep inside into the influencers causing the issue eventually. Once the issue is discovered and eliminated by the team, it shall allow the team to keep an eye on why the issue occurred. Also, it will let one keep an eye on the history or symptoms of the problem. Moreover, from this diagram, analysts will be able to view the snapshot, which shall be real-time, of the collective inputs that the team has provided.
One shall use this fishbone diagram template in word to represent causality, and it will have two causes: primary and secondary. The 1st is the primary cause, which would directly result in the effect. While the other one, which is the secondary cause, is the one that shall lead to a primary cause indirectly. It will not have an end effect directly.
The brainstorming sessions to handle any problem can be both fun and complex. Different ideas and suggestions are contributed to identify the main cause so that a solution can be reached. However, a readymade template of a fishbone diagram will facilitate the process because it is a useful tool that creates a path to explore complex problems, pin-point the cause of it.
There are many websites that provide readymade templates or fishbone diagram template in word related to the same which are free and quite well organized. They can be successfully used as a ready-made format for the process. Some business can also create their own excel format for the same.
Components
Companies can design per their requirement of word or excel fishbone diagram template. However, the generalized format is below:
TOP PART
Part 1 – All of the Top Boxes
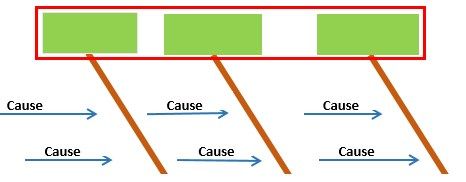
The number of boxes is not defined for the template. There can be multiple templates per the requirement and the problem’s factors. These boxes shall represent the main root causes, and they have to be grouped into, and then they have to be displayed here. They must be generalized as there could be multiple similar reasons driving the same factor or root cause. These groups can also be sources that shall represent the issue.Example: If the company is looking into low customer satisfaction, and if the reason they found out is ineffective marketing or the cost of materials, etc., these two can be grouped into one source called high pricing as one of the reasons.
Part 2 – All of the Arrows Representing the Boxes
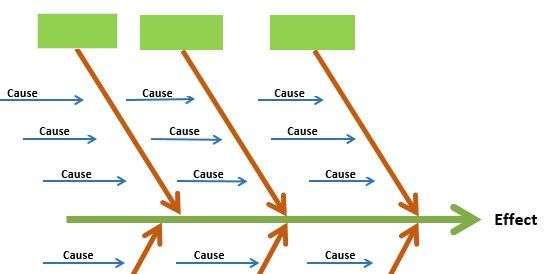
In this part, the team can now group the various causes into one common group, leading to the same. The same example is discussed above, wherein the company is trying to figure out the various reasons for customer dissatisfaction. Wherein we discussed the sources, such as ineffective marketing or cost of materials. It will be displayed under small arrows, which in the above diagram tags as the cause of word or excel fishbone diagram template. There could be the second group tagged as low-quality products wherein the multiple causes could be a bad quality raw material or bad design of the product or the employees. Those who are involved in servicing the product are ineffective.
Part 3 – All of the Bottom Boxes
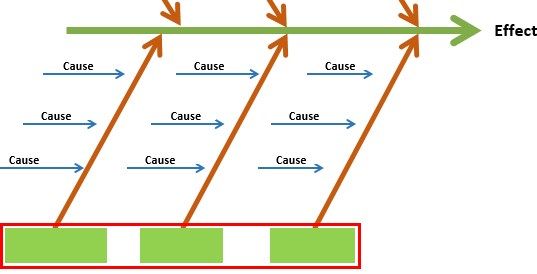
Here again, the content would be the same; that one needs to include the group sources of the problems that lead to an effect. Since the design is the fish type and hence the groups split into two parts, one is the top part, and the second one is the bottom part. Again, it isn’t necessary to keep the count, but one can insert any one reason at the bottom for better representation and complete the picture.
Part 4 – All of the Bottom Arrows
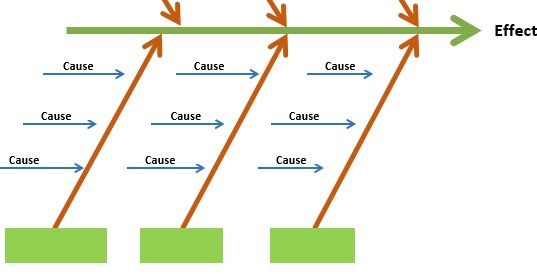
Now, here again, the content would be the same; that is, the reasons or the causes leading to the main group cause-effect and eventually leading to the problem. It is easy to represent the issues, group them, and take corrective action.
Example
Let us understand the concept of fishbone diagram template free with the help of a suitable example, as given below:
We assume that ABC Ltd is a computer parts supplier who need to cater to customers of different levels, corporate or individual. They need to make supplies within limited time in case of new companies who are setting up offices and want to start immediately. But of late, the management has noticed that there is delay in the process, leading to loss of customers. They managers decide to use a fishbone diagram template to solve the problem and finally successfully identifies the causes to be the following:
- Defective parts received from wholesellers
- Time consumed to replace them.
- Outdated software used to keep track of inventory, leading to stock mismanagement.
- Supply-chain issues.
Thus, through this fishbone diagram template free the management is able to design strategies to control and solve the problem.
It is necessary to remember that a good template can be characterised by a clear format that can be easily interpreted and analysed by anyone. The labelling and the structure prepared should not be complex that may create confusion.
Moreover, the template should be easily accessible to all those who are responsible for driving operational and decision-making issues within teams and should have the required features for editing. It must have the adaptability to change and made customized as per the requirement of the situation and varying problem complexity. The template should also be visually appealing to users so that the process does not become monotonous.
How To Use?
- The Fishbone diagram is similar to a fish’s skeleton wherein the problems are its head and the factors or the reasons for the issue or the problem feeding into the spine.
- One needs first to identify the main problem. The example discussed above was customer dissatisfaction with the main problem. Next, the team would start brainstorming the reasons for customer dissatisfaction, including low-quality products, high pricing, poor sales support, etc.
- Now, these factors will form the head that is directly leading to the effect, which is customer dissatisfaction. Further, there will be issues that lead to these main heads. For example, in case of poor sales support, the reasons could be long waiting queues whenever the customer arrives, the fees charged for the sales support provided, and the time taken to resolve the customer’s issue.
- So, these little reasons won’t directly lead to customer dissatisfaction, but eventually and indirectly, they shall lead to it. Hence, one can represent this in one blank fishbone diagram template and present the same to the higher management.
- Hence, once all the factors or causes that underlie the issues of the problem have been recognized. Then, the team leaders can initiate looking for a resolution or solutions to ensure that the issue or the problem doesn’t become one that shall recur.
As pointed out above, the concept has a lot of uses in the industry and if implemented at the proper place and time in the correct manner, it an make the business process smooth, efficient and effective. It is possible to summarize its uses by pointing out the advantages of using the concept, as given in the list below:
- Blank fishbone diagram template creates a visual procedure to identify the problems and design solution based on them. Visual effect helps in recording the thoughts and ideas in a systematic manner so that they can be organized in a way that is logical and less complex.
- It is a very useful tool in final decision making because the ideas gene rated from the brainstormed sessions are recorded, organized, and properly summed up so that they can be discussed in a way that will lead to a logical and informative decision and conclusion.
- Since the template is a readymade document that acts as a guide to identify potential problem areas, it increases the efficiency of streamlining the operational process, reducing wastage of tiem or other valuable resource and increasing overall efficiency of the business.
- Finally, issues are resolved quickly as compared to normal procedure of discussion and analysis.
Thus, this template is an excellent tool for figuring out the cause of a problem, navigating to the depth of it and solve it with a straightforward approach and vision that may prevent the issue from recurring again in future.
Recommended Articles
This article has been a guide to what is Fishbone Diagram Template. We explain it with example, how to use it along with its components. Also, you can download and use this template in Excel, PDF, or CSV format.