What Is A Fishbone Diagram?
The Fishbone diagram or Ishikawa diagram is a modern quality management tool that explains the cause and effect relationship for any quality issue that has arisen or that may arise. It provides the visual representation of all the possible causes of a problem to analyze and find out the root cause. It is a tool that can be used both proactively and reactively.
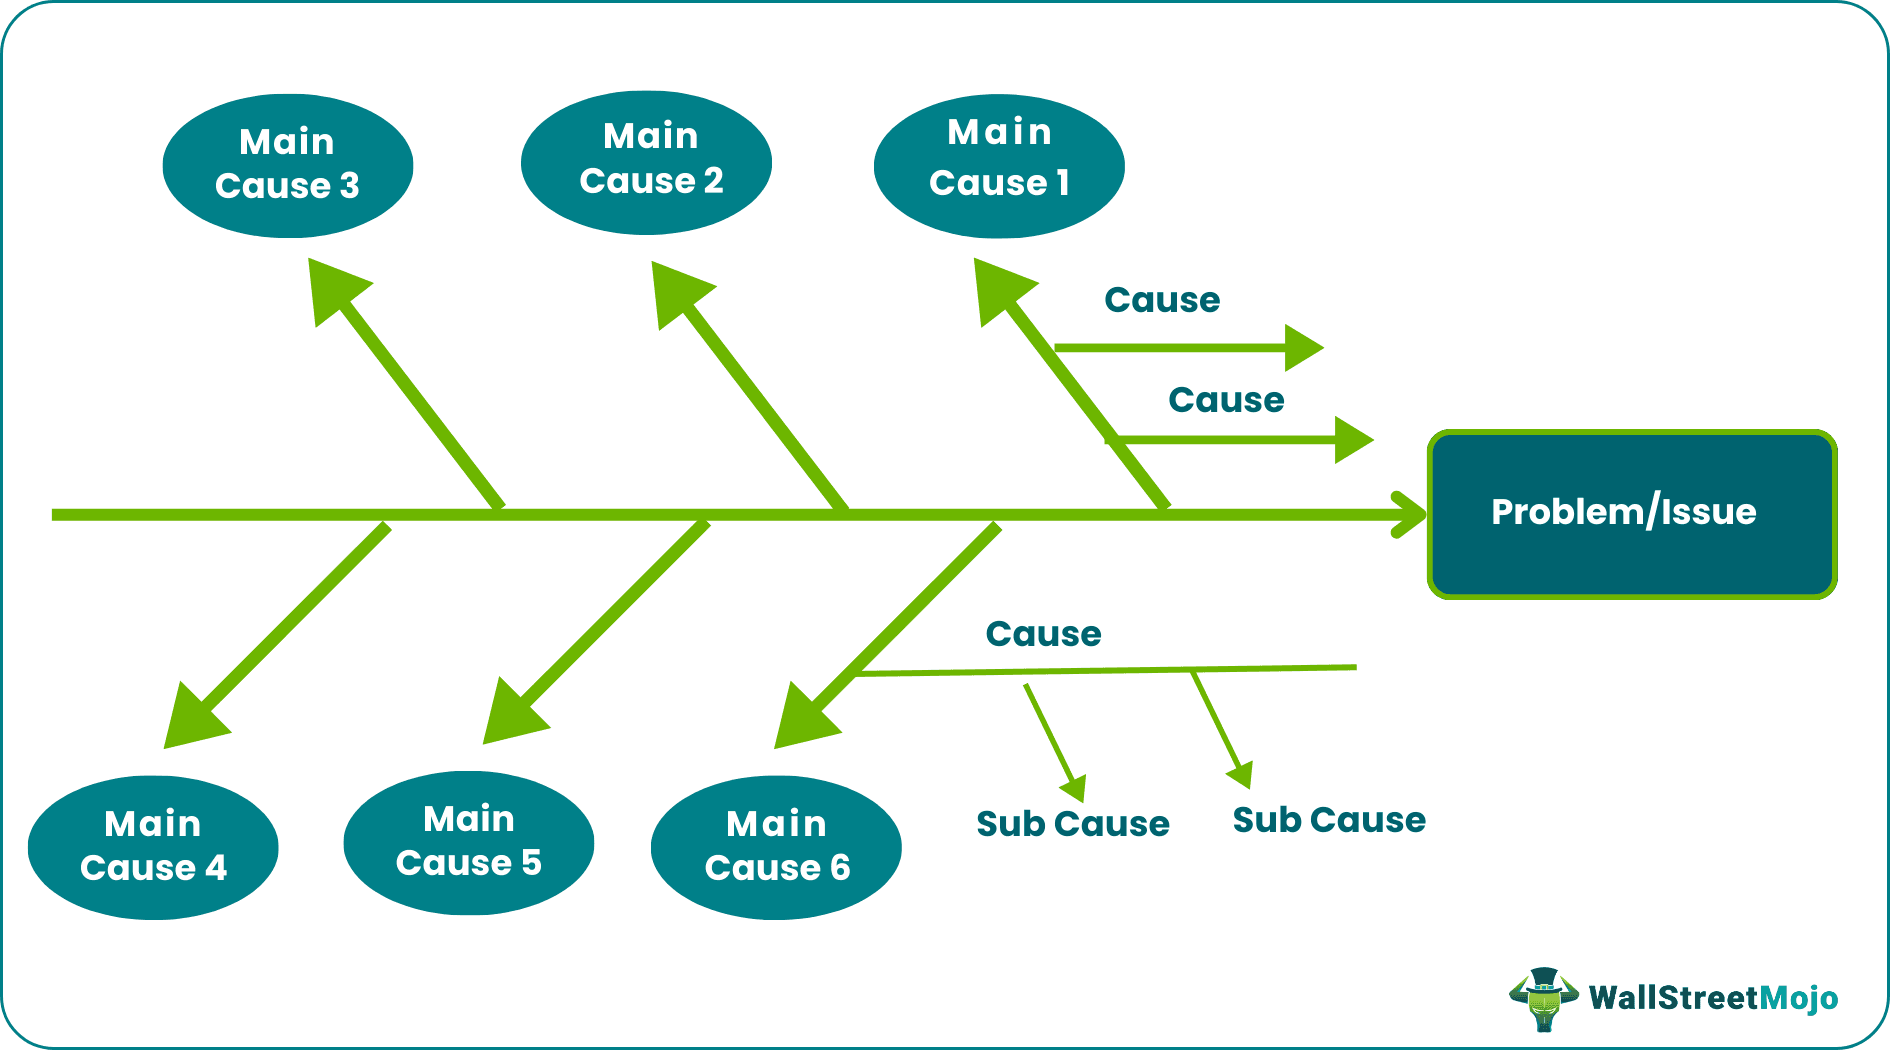
The name fishbone diagram comes from the shape this tool takes after its formation. Its structure resembles the bone structure of fishes. The problem is written in the rightmost part, the fish’s head. On the left runs its spine, which has bone-like arrows pointing to the main causes. Under those main causes are determined the sub-causes.
Fishbone Diagram Explained
The fishbone diagram, created by Kaoru Ishikawa and named after him,is a visual representation of cause-and-effect relationships. It is simple to use the tool yet very effective in improving a process and the quality of a product or service. With its continuous implementation, an organization can be proactive in determining any process shortcoming and address problems quickly and accurately.
The business organization can effectively use this tool to achieve six-sigma results in its processes. It can be drawn on paper, a spreadsheet, any word processing software, or with the assistance of much online software.
If the above diagram is referred to, the problem/issue is mentioned on the right, and the main causes are mentioned on the tip of bones stretching from the spine bone. Under these main causes are mentioned the causes and sub-causes. This diagram can either be drawn on an excel sheet However, many online websites and templates provide users with ready-to-use fishbone diagram templates.
Types
There are different types of fishbone diagrams that can be created for proper problem-solving. Based on the categorization of the causes, the diagram has been divided into four categories:
- Simple fishbone: This offers a flexible categorization of causes, depending on factors unique to one organization or business.
- 4S fishbone: Surroundings, Skills, Suppliers, and Systems are the categories in which the causes are classified.
- 8P fishbone: The 8Ps stand for Price, Promotion, People, Processes, Plant, Product, Policies, and Procedures. Here, the causes are grouped into these categories.
- Man Machines Materials fishbone: In this case, the fishbone diagram cause and effect are categorized into categories, like Man, Machines, Methods, Measurements, Money, Maintenance, and Environment.
How To Make?
Follow the steps to create a fishbone diagram.
- Make the head of the fish on the right. Here we mention the subject that needs our attention.
- Draw a backbone on the left.
- Draw branches to the backbones that will list the main causes. List four to eight main causes.
- Under these main causes are listed the causes and sub-causes. These can be identified by organizing a brainstorming session or minutely following the whole process and identifying all the possible reasons that can lead to quality damage.
How To Use?
A fishbone diagram helps in root cause analysis to identify the causes behind the emergence of difficulty and problems. Once the causes are identified, the classification is done based on which category-wise ideas come up as solutions to those problems.
For the identification of factors causing a problem, the reasons are classified into the following categories:
- Machine
- Materials
- Methods
- Personnel (Men)
- Measurements
- Environment
Alternatively, the five why-technique or the 4 P’s (Product, Policies, Procedures, and Plant) can also be identified for the classification of factors so that one can group the causes as deemed fit.
Examples
Let us check the fishbone diagram examples below to understand the concept better:
Example #1
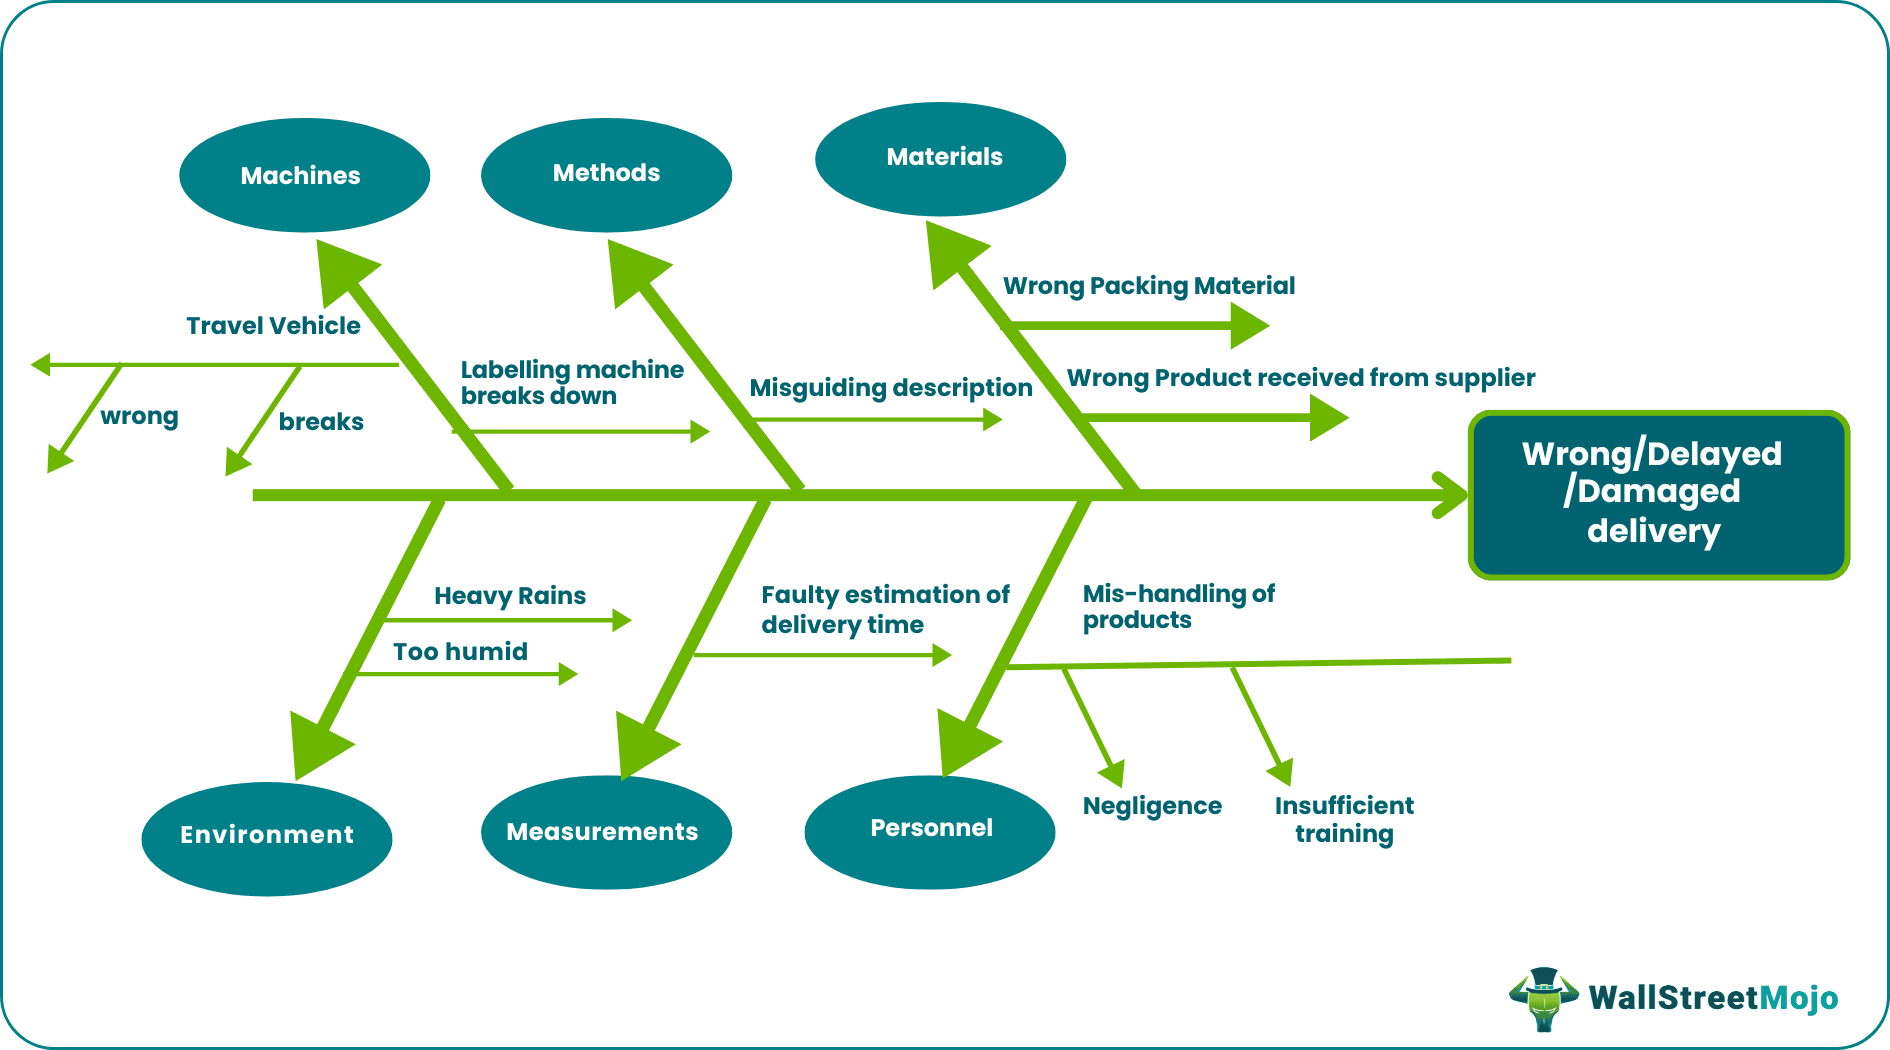
Let’s try an example where the problem that needs our attention is wrong/delayed/damaged delivery. The possible reasons are many, like faulty packaging that led to damage during transit, the wrong product being released for delivery, or the address label on the product wasn’t correct. We can classify the same in main causes and present it in the fishbone diagram like below:
Example #2
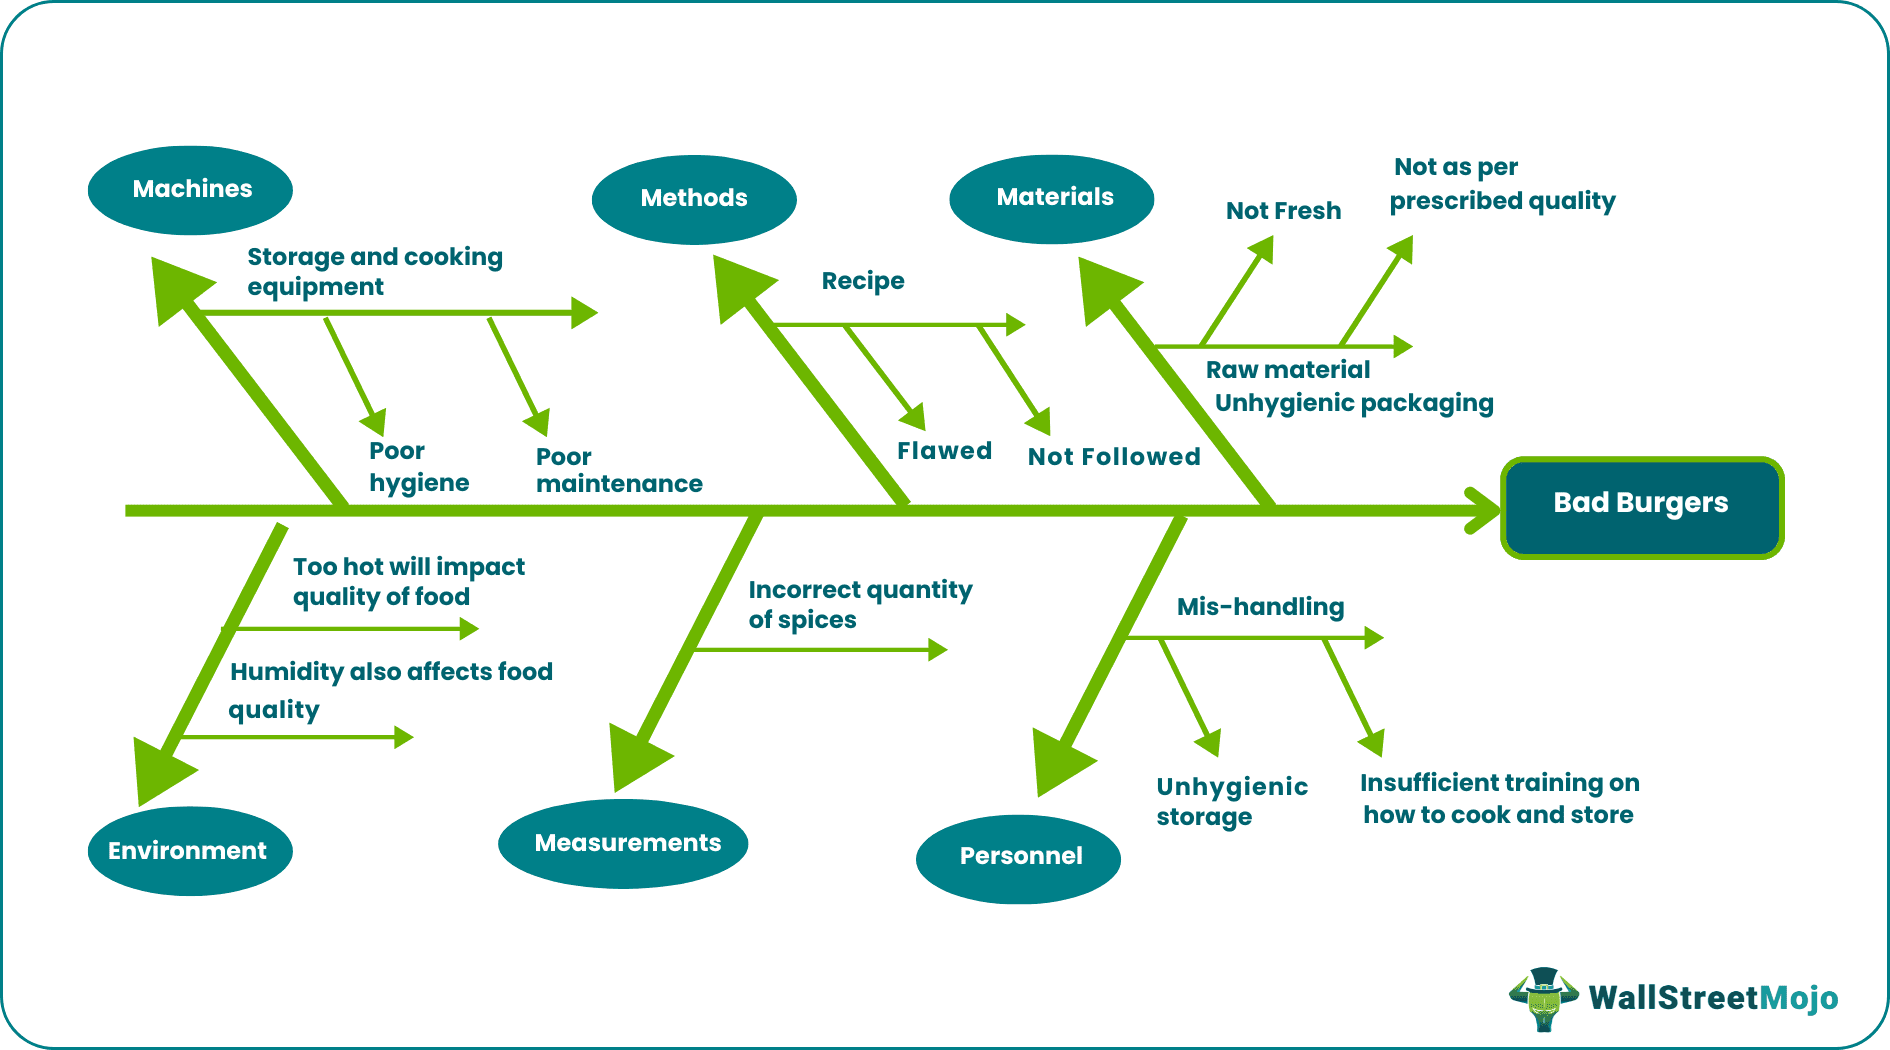
Let’s take one more example. Looking at how well we addressed the above problem, we have hired consultants from a burger store to identify the reasons for preparing a bad-quality burger. The question sounds tasty. I mean engaging.
Advantages & Disadvantages
The Ishikawa fishbone diagram has several benefits, but it also has some flaws at the same time. Let us have a look at them:
Benefits
- This technique is widely used in product design, quality improvement, and defect minimization.
- Instead of pointing out just one reason, this technique gives us a gamut of all the possible reasons that assist not only in identifying the root cause of the current problem and avoiding any future mishappening.
Limitations
This technique should not be used as a one-time activity. Instead, this activity should be undertaken continuously to be proactive in determining any possible loophole.
Recommended Articles
This article is a guide to what is a Fishbone Diagram. We explain it with examples, how to make and use it along with its advantages, disadvantages, and types. You can learn more about financing from the following articles –