Part of our Statistical Concepts guide
Statistics Meaning
Statistics transforms raw data into meaningful results. It is the science behind the identification, collection, organization, interpretation, and presentation of data. Data could be qualitative or quantitative. Statistics makes information-based decision-making easier.
Statistics comprises useful data interpretation tools like mean, median, mode, standard deviation, coefficient of variance, and sample tests. Raw financial data in a numerical format is interpreted using mathematical formulas. Many sectors like science, government, manufacturing, population, psychology, banking, and financial markets rely on statistical data.
Key Takeaways
- Statistics is a discipline that applies various tools and techniques to process raw data and ultimately outputs conclusive results.
- The statistical process includes collection, organization, summarization, interpretation, and reporting of information.
- This mathematical discipline is broadly classified into descriptive and inferential sub-divisions. The descriptive branch deals with the quantitative representation of data. In contrast the inferential statistics focuses on interpreting results.
- For decision making crucial statistical properties like uniformity, efficiency, sufficiency, and quantitative analysis are focused upon.
Statistics Explained
Statistics is the systematic processing and interpretation of raw data to compile a conclusive result. These reports are drafted in a numerical format. They are presented in a succinct manner so that one can read and understand easily. One should be able to comprehend them at a mere glance.
Financial data is in a numerical format and includes details about portfolios, investments, and assets. Historical data and present data are interpreted using mathematical formulas. Forecasts are based on available information and requirements.
Application of Statistics
Statistics is indispensable for decision-making in various sectors and verticals. It is applied in marketing, e-commerce, banking, finance, human resource, production, and information technology. In addition, this mathematical discipline has been a prominent part of research and is widely used in data mining, medicine, aerospace, robotics, psychology, and machine learning.
Not to forget the economics, government, and public sectors where statistical data is a significant part of decision-making. For example, it is used for public surveys, weather forecasts, sports scoring, and budgeting.
Role of Statistics in Finance
In the finance sector, statistical data facilitate decision-making. For instance, a watch manufacturing company can use statistical tools to determine the percentage of defective watches in every lot.
At a macro level, it helps in understanding a country’s financial state and measuring economic growth. At a micro-level, statistics helps analysts determine a company’s business income, earnings, and revenue-generating capacity.
Be it preparing budgets, financial forecasts, monitoring a company, or a country’s performance, statistics is everywhere.
Statistics Example
Lets’ take an example to understand the application of statistics. PNU Productions manufactures fashion clothes for kids. Now, the company is planning to expand into a new line of business, i.e., fashion garments for women. However, before expanding, the management prepares a forecast of customer preferences and expectations.
There are around 5 million women who can potentially be target customers. So, the management decided to survey 1000 women from different areas and of varying age groups. The survey aimed to find out needs and choices in fashion outfits. This way, the statistical analysis helped the company make an effective decision.
In the practical world, this mathematical discipline is applied widely to catch the nerves of a particular stock movement. Also, statistical computer models consider the historical prices of a specific stock to interpret its future performance and returns. These tools analyze economic trends and determine the business cycle.
Properties
Various statistical properties make this discipline useful for crucial decision-making and research in different fields. Let us discuss some of these:
- Uniformity: Most data sets used in evaluations are similar. To ensure consistency; data is collected using a set base of parameters.
- Efficiency: If the available information deviates from sample data, it can still be interpreted using specific formulas.
- Sufficiency: The sample data analysis represents complete information about the whole population, which makes this method apt for extensive data sets.
- Quantitative Analysis: The numerical form of statistical data makes it easier to understand and interpret results.
- Unbiased: It is purely based on parameters and mechanisms, and therefore, reliable, offering no adjustments.
Types of Statistics
Given below are the two different forms of statistical approaches:
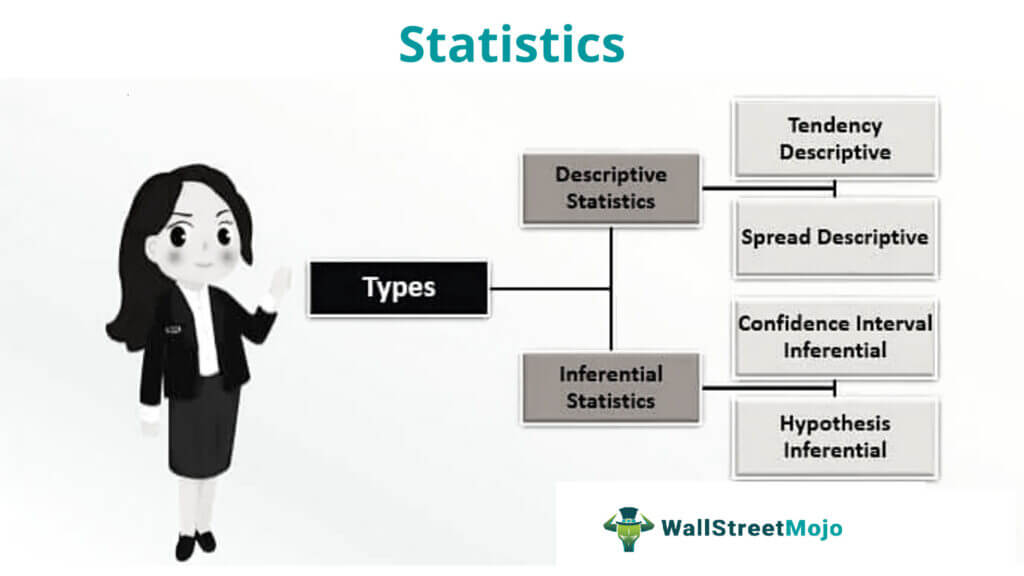
#1 – Descriptive
Descriptive Statistics refers to data that shows the fundamental aspects of a selected population. Also, it establishes how it was organized and presented. The data can be analyzed by simply looking at the provided information and referring to how it is arranged. It is further classified as follows.
- Tendency Descriptive: It uses simple mathematical calculations and can be analyzed by computing the mean, median, and mode for the data under consideration.
- Spread Descriptive: This form focuses on whether different sets of data are relative to each other or not. Generally, it includes a description using variances, deviation methods, range of data, and distribution.
#2 – Inferential
The inferential discipline focuses on arriving at a conclusion based on the sample evaluation. It is further classified into:
- Confidence Interval Inferential: It refers to statistical data drawn from real numbers. However, the parameter concerning its actual data size may not be known.
- Hypothesis Inferential: This type analyzes extensive data based on a small sample size.
Limitations of Statistics
There is a downside to relying on statistical data. Following are its limitations:
- It emphasizes average values, but the individual data can vary to a great extent.
- Most of the time, the qualitative aspect of data analysis is overlooked.
- In the absence of relevant data, a statistical conclusion has no significance.
- Statistical analysis is always prone to human errors, and this may result in false conclusions.
- There are numerous statistical formulas to choose form making it difficult for the researcher.
- Using this mathematical discipline to solve problems requires a lot of expertise.
- Statistical processes end with a result but often fail to find the reasons behind the result.
Frequently Asked Questions (FAQs)
What does statistics mean?
It is the science behind identifying, collecting, organizing, summarizing, analyzing, interpreting, and presenting data. The data could be either qualitative or quantitative. This mathematical decision is employed in decision-making.
Why is statistics important?
Statistical data analysis plays a crucial role in scientific discoveries, research, economic decisions, government budgeting, public welfare activities, weather forecast, and stock analysis. In addition, this mathematical discipline makes decision-making more objective.
It is an essential part of day-to-day life even. For instance, it is used in schools and colleges to find the average percentage of the students. Similarly, In households, it is used to determine the per-day expense.
What is the difference between descriptive and inferential statistics?
Descriptive discipline is the quantitative part of the statistical analysis. The raw data is first collected and organized. Then it is presented in a succinct manner. The inferential subtype, on the other hand, focuses on interpreting sample data to form conclusions.
Recommended Articles
This has been a guide to What is Statistics and its Meaning. Here we explain how statistics work, its application, types, roles, properties, and limitations. You may also have a look at related articles on finance –