


What Is Multivariate Analysis?
Multivariate analysis represents the process of analyzing multiple variables simultaneously to seek and identify any link between them. In finance, it allows researchers, business analysts and statisticians to spot correlations and patterns in security prices and performance history, making insightful data by analyzing multiple variables simultaneously.
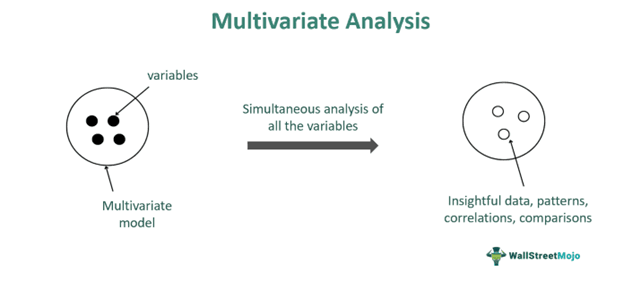
Initially, each aspect of a stock or company, such as financial metrics, ratios, and price movement, is considered independently for objective analysis. However, it’s crucial to recognize that these elements often coexist and are interdependent, playing a significant role in predicting future stock prices and market trends. It is considered an update on univariate and bivariate analysis, which were only limited to one or two variables.
Key Takeaways
- Multivariate analysis is the computation and interpretation of more than two variables simultaneously.
- Help firms and researchers perform complex calculations to spot patterns and identify trends as a data science system.
- It requires an enormous amount of data; the larger the sample, the more accurate it provides the results.
- Based on its insights, companies make decisions, regulate policies, improve efficiency and predict future outcomes.
Multivariate Analysis Explained
Multivariate analysis is the process of bringing together more than two dependent variables to analyze an objective investment output. Not all hypotheses or structures need to be multivariate. Still, it helps examine different datasets and elements modeled in a system to seek insightful comparison, data and estimation based on which future events can be predicted so that firms can make better decisions. In simple words, to test a hypothesis or arrive at a result, its dependency is based on several variables; the multivariate analysis involves each of them and evaluates simultaneously to offer valuable insights.
The multivariate analysis data has a brief history starting from 1928 when a paper was published by John Wishart a British statistician explaining the precise distribution of covariance matrix in a multivariate population. In the 1930s, many contributions were made by Fischer, Hotelling and S.N Roy, which were majorly used in education, psychology and biology. Only with the expansion of computers in the 1950s new methods and theories were proposed, and the scope of multivariate analysis expanded, especially extending to the financial scenario. Today multivariate analysis is an excellent tool to measure portfolio risks and make proper financial decisions.
Unlike business strategies and projects, multivariate analysis regression is observed in many real-life situations where more than two dependent variables are studied to conclude with a single regression model. In simple words, the model has more than one predictor variable. The analysis plays a key role in data sciences and traditional statistics; however, the model, structure and calculations can be expensive and complex for researchers to perform and accumulate.
Methods
The methods of multivariate analysis are categorized accordingly based on the requirement, type of data, objective and model structure; the common methods are –
- Factor analysis – the model eliminates the unrequited data and focuses on individual variables subdivided for correspondence and component analysis.
- Cluster analysis – individual variables are assigned with graphical observations and categorized according to them, making segments, for example, buyers of a particular age group with a set income bracket.
- Variance analysis – denotes the impact of single and multiple variables on groups, allowing inter-group comparison along with other groups, taking into account the deviation in data.
- Regression analysis – it aims to observe the impact of two types of variables on each other. The dependent variables are explanatory, and the independent variables are explanatory; the former explains the present basic data state, and the latter indicates the dependency relationship.
- Discriminant analysis – it helps in distinguishing groups of datasets with similar characteristics, mostly used under the variance analysis context.
Examples
Below are two simple examples of multivariate analysis –
Example #1
Suppose there is a midcap stock that many investors have been tracking for months and believe has high growth potential. David, who is a technical investor, decides to perform a multivariate analysis on it.
David collects all the data related to the stock, such as company fundamentals, PE ratio, current ratio, book value, market news, industry updates, historical price movement, dividend yield, performance in the bear market, stock price fluctuations, debt-to-equity ratio and moving average.
David also listens to what market experts have to say about the stock’s future growth and tries to find any form of link it has with government policies and everything. David treats each piece of information or data as a single variable and finds that they are interdependent in some capacity.
It is a simple multivariate analysis example. David is analyzing multiple variables simultaneously to spot patterns and links. Fortunately, he is able to seek a common link between all the variables and is able to predict the future stock price in the next nine months.
Example #2
In a medical study, the researchers gauged the cortical and subcortical asymmetries in schizophrenia with a sample of 46 datasets. Schizophrenia is categorized by affective flattening, hallucinations, delusions and executive function deficits. The sensitivity analysis determined the heterogeneity of differences between datasets. Finally, a multivariate analysis on 14 datasets was done simultaneously with the objective of group difference determination in one model.
A prominent brain asymmetry distinction was noticed in the multivariate analysis with 935 cases and 1094 controls, contributing to 7% variance across all AIs. The findings suggest that schizophrenia is similar in either of the brain hemispheres. The 7% variance was elaborated by the case-control group difference in multivariate analysis, indicating a diffuse alteration of brain asymmetry in schizophrenia.
Advantages & Disadvantages
The advantages of multivariate analysis are –
- It analyzes multiple variables simultaneously, saving time and effort for businesses and researchers.
- Provides useful insights and allows firms to spot patterns and correlations between two or more variables.
- It helps predict future outcomes, and hence companies take necessary actions, be prepared.
- Improves efficiency and identifies links between variables that may have remained unnoticed in individual analyses.
The disadvantages of multivariate analysis are –
- The process demands sufficient data input to offer reasonable outcomes.
- Required complex calculation and computation in arithmetic operations.
- The statistical analysis and programs required are expensive.
- Everyone does not easily understand the interpretation of data and analysis.
Multivariate vs Univariate vs Bivariate Analysis
The key differences between multivariate, univariate and bivariate analysis are –
- Multivariate analysis can process more than two variables at the same time. Univariate performs analysis of one variable at a time, but multivariate summarizes two variable evaluations simultaneously.
- Multivariate analysis has a purpose to spot patterns; univariate has an objective to describe, but bivariate aims to explain.
- Univariate and multivariate analysis does not deal with causes and relationships when processed, but bivariate does deal with them.
- Multivariate and bivariate have one dependent variable, but univariate does not have any dependent variable.
Frequently Asked Questions (FAQs)
Frequently Asked Questions
What is a multivariate analysis of variance?
The process, also known as MANOVA, offers regression analysis and analysis of variances present in multiple dependent variables. The analyst can test for a null hypothesis and investigate links between multiple variables and their effects. A general linear model is opted to factor variables in different groups. In this process, the independent variables are categorical, and the dependent variables are metric.
In what situations should multivariate analysis be used?
The four main uses of multivariate analysis are – – To seek data patterns – Elimination of unwanted information – To compare and collate data – Study multiple factors simultaneously
What are the best practices for multivariate analysis?
The multivariate analysis has two basic groups, metric and nonmetric methods; the best practices to apply are – – Have a logical structure and format – Use of tables, charts and graphs to summarize and highlight findings. – The analysis must be done consistently with a clear and concise process.