Current Ratio Meaning
The current ratio is a liquidity ratio that indicates a company’s capacity to repay short-term loans due within the next year. It helps investors gauge a company’s ability to meet their financial obligations and compare financial soundness with other competitors or stocks. However, it struggles with its comparison with different industry groups.
The current ratio equation is a crucial financial metric, that assesses a company’s short-term liquidity by comparing its current assets to its current liabilities. A ratio above 1 indicates the company can meet its short-term obligations, while below 1 suggests potential liquidity issues. It aids in evaluating a firm’s financial health and ability to cover immediate debts.
Current Ratio Explained
The current ratio is a fundamental financial metric that provides valuable insights into a company’s short-term financial health. Imagine it as a financial health checkup for a business, telling us whether it’s equipped to handle its immediate financial responsibilities or if it might be struggling to meet its short-term obligations.
It’s a simple ratio calculated by dividing a company’s current assets by its current liabilities. Current assets include cash, accounts receivable, inventory, and any other assets expected to be converted into cash within a year. Current liabilities, on the other hand, are debts and obligations due within the same timeframe.
Here’s why an optimal current ratio is so significant: It gives us a quick snapshot of a company’s liquidity, and its ability to pay off its short-term debts. If the current ratio is greater than 1, it generally suggests that the company has enough current assets to cover its current liabilities. In other words, it’s in a pretty good financial position to meet its immediate financial obligations.
On the flip side, if the current ratio falls below 1, it could be a red flag. This indicates that the company might not have enough short-term assets to settle its debts as they come due. This could lead to liquidity problems, which might require the company to borrow more or sell assets at unfavorable terms just to keep the lights on.
Therefore, the current ratio is like a financial health thermometer for businesses. It helps investors, creditors, and management assess whether a company can comfortably navigate its short-term financial waters or if it’s sailing into rough financial seas. It’s a key indicator in the world of finance that’s worth keeping an eye on to make informed decisions about a company’s financial stability.
Formula
Let us understand the formula that shall act as the basis for using a current ratio calculator through the discussion below.
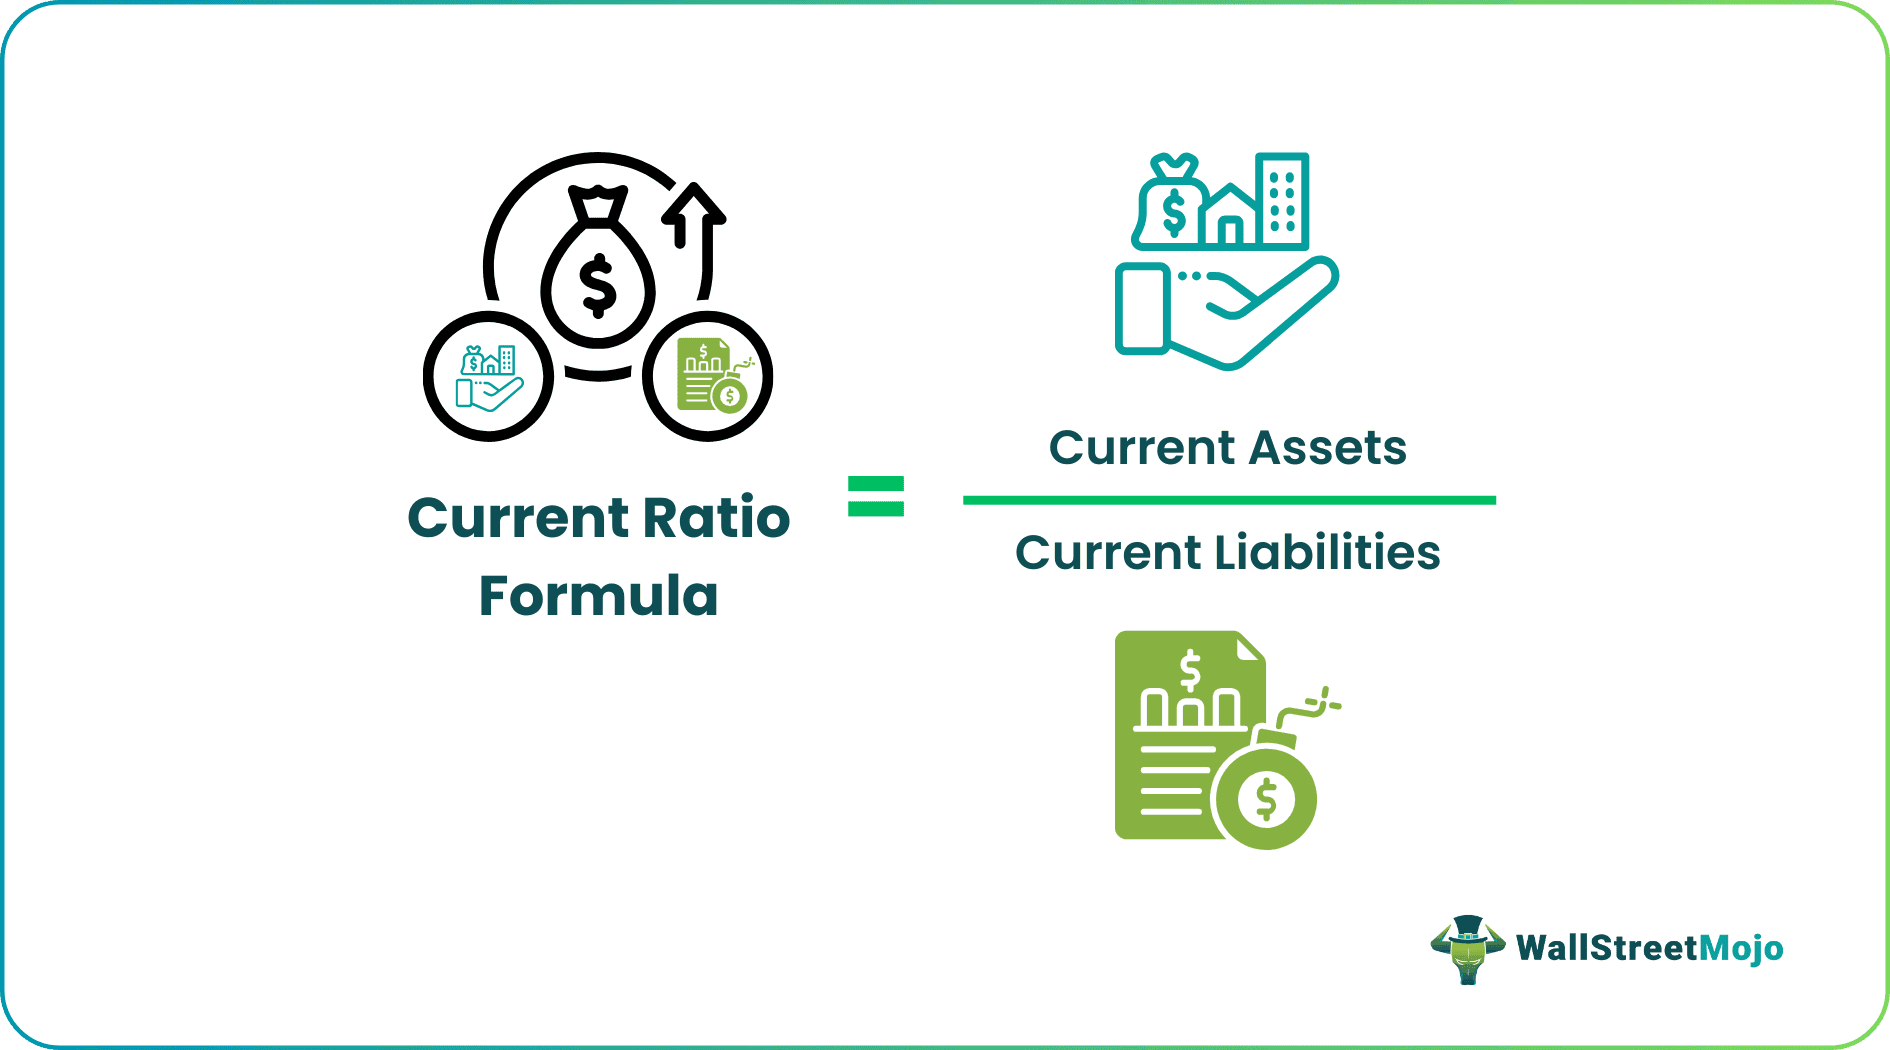
Current Ratio Formula = Current Assets / Current Liabilities.
If a company’s current assets are $200 million and current liability is $100 million, then the ratio will be = $200/$100 = 2.0.
| Current Assets | Current Liabilities |
|---|---|
| Cash & cash equivalents | Accounts Payable |
| Investments | Deferred Revenues |
| Accounts Receivable and Accounts Payable | Accrued Compensation |
| Notes receivable maturing within one year | Other accrued expenses |
| Other receivables | Accrued Income Taxes |
| Inventory of raw materials, WIP, finished goods | Short Term notes |
| Office supplies | Current Portion of Long term debt |
| Prepaid expenses | |
| Advance payments |
How To Calculate?
To derive an optimal current ratio, one needs two essential figures from the company’s balance sheet: current assets and current liabilities. Let us understand the process of calculating through the step-by-step guide below.
First, we must locate the current assets, which encompass cash, accounts receivable (outstanding payments owed to the company), and inventory (goods ready for sale). Combine the values of these items to determine the total current assets.
Secondly, we must identify the current liabilities, which encompass the company’s debts and obligations due within a year, such as accounts payable and short-term loans. Sum these figures to calculate the total current liabilities.
With both values in hand, one can proceed to calculate the current ratio by dividing the total current assets by the total current liabilities. The formula to calculate the same is as discussed above.
Current Ratio Explanation in Video

Interpretation
We have discussed the formula and how to calculate in detail. However, the end result of the calculation could mean different things based on the result. Let us understand how to interpret the data from a current ration calculator through the discussion below.
- If Current Assets > Current Liabilities, then Ratio is greater than 1.0 -> a desirable situation to be in.
- If Current Assets = Current Liabilities, then Ratio is equal to 1.0 -> Current Assets are just enough to pay down the short-term obligations.
- If Current Assets < Current Liabilities, then Ratio is less than 1.0 -> a problem situation at hand as the company does not have enough to pay for its short-term obligations.
Examples
Now that we are clear about the basics, formula, and how to calculate, and interpret a current ratio equation, let us apply this knowledge to practical application through the examples below for a better understanding of the concept and its related factors.
Example #1
Which of the following companies is better positioned to pay its short-term debt?
| Particulars | Company A | Company B | Company C |
|---|---|---|---|
| Current Assets | 300 | 160 | 400 |
| Current Liabilities | 200 | 110 | 180 |
| Current Ratios | 1.50 | 1.45 | 2.22 |
From the above table, it is pretty clear that company C has $2.22 of Current Assets for each $1.0 of its liabilities. Company C is more liquid and is better positioned to pay off its liabilities.
However, please note that we must investigate further if our conclusion is true.
Let me now give you a further breakup of Current Assets, and we will try and answer the same question again.
| Particulars | Company A | Company B | Company C |
|---|---|---|---|
| Cash | – | 160 | – |
| Receivables | 300 | – | – |
| Inventory | – | – | 400 |
| Current Assets | 300 | 160 | 400 |
| Current Liabilities | 200 | 110 | 180 |
| Current Ratios | 1.5 | 1.45 | 2.22 |
Company C has all of its current assets like inventory. For paying the short-term debt, company C will have to move the inventory into sales and receive cash from customers. Inventory takes time to be converted to cash. The typical flow will be Raw Material inventory -> WIP Inventory -> Finished goods Inventory -> Sales Process takes place -> cash is received. This cycle may take a longer time. As inventory is less than receivables or cash, the calculated current ratio of 2.22x does not look too great this time.
Company A, however, has all of its current assets as Receivables. Therefore, company A will have to recover this amount from its customers to pay off the short-term debt. Therefore, there is a certain risk associated with non-payments of receivables.
However, if you look at company B now, it has all cash in its current assets. Therefore, even though its ratio is 1.45x, strictly from the short-term debt repayment perspective, it is best placed as it can immediately pay off its short-term debt.
Example #2

The current ratio is calculated as the current assets of Colgate divided by the current liability of Colgate. For example, in 2011, Current Assets were $4,402 million, and Current Liability was $3,716 million.
= 4,402/3,716 = 1.18x
Likewise, we calculate the Current Ratio for all other years.
The following observations can be made with regards to Colgate Ratios –
This ratio increased from 1.00x in 2010 to 1.22x in the year 2012.
- The primary reason for this increase is built-up of cash and cash equivalents and other assets from 2010 to 2012. In addition, we saw that the current liabilities were more or less stagnant at around $3,700 million for these three years.
- We also note that its ratio dipped to 1.08x in 2013. The primary reason for this dip is the increase in the current portion of long term debt to $895 million, thereby increasing the current liabilities.
Seasonality & Current Ratio
It should not be analyzed in isolation for a specific period. Instead, we should closely observe this ratio over some time – whether the ratio is showing a steady increase or a decrease. However, in many cases, you will note that there is no such pattern. Instead, there is a clear pattern of seasonality in current ratio equations. Take, for example, Thomas Cook.
I have compiled below the total current assets and total current liabilities of Thomas Cook. You may note that this ratio of Thomas Cook tends to move up in the September Quarter.
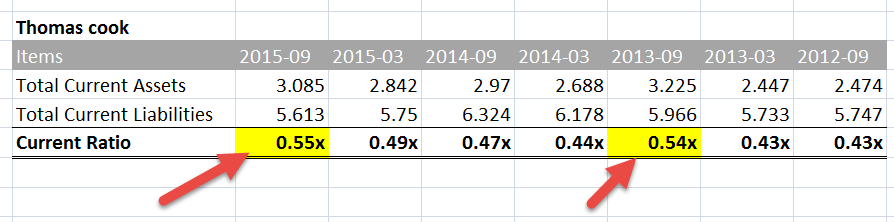
Seasonality is normally seen in seasonal commodity-related businesses where raw materials like sugar, wheat, etc., are required. Such purchases are done annually, depending on availability, and are consumed throughout the year. Such purchases require higher investments (generally financed by debt), increasing the current asset side.
Automobile Sector
To give you an idea of sector ratios, we have picked up the US automobile sector.
Below is the list of US-listed automobile companies with high ratios.
| S. No | Company Name | Ratio |
|---|---|---|
| 1 | Ferrari | 4.659 |
| 2 | Supreme Industries | 3.587 |
| 3 | Ford Motor | 3.149 |
| 4 | SORL Auto Parts | 3.006 |
| 5 | Fuji Heavy Industries | 1.802 |
| 6 | Sime Darby | 1.71 |
| 7 | Isuzu Motors | 1.603 |
| 8 | Nissan Motor | 1.588 |
| 9 | Mitsubishi Motors | 1.569 |
| 10 | Toyota Industries | 1.548 |
Please note that a Higher ratio may not necessarily mean that they are in a better position. It could also be because of –
- slow-moving stocks or
- lack of investment opportunities.
- Also, the receivables collection could also be slow.
Below is the list of US-listed automobile companies with low ratios.
| S. No | Company Name | Ratio |
|---|---|---|
| 1 | Saleen Automotive | 0.0377 |
| 2 | BYD Co | 0.763 |
| 3 | Greenkraft | 0.7684 |
| 4 | BMW | 0.935 |
If the ratio is low due to the following reasons, it is again undesirable:
- Lack of sufficient funds to meet current obligations and
- A trading level beyond the capacity of the business.
Limitations
We have discussed a lot about the advantages and benefits of having an optimum current ratio. However, there are a few factors from the other end of the spectrum that prove to be a disadvantage. Let us understand them through the explanation below.
- It does not focus on the breakup of Assets or Asset Quality. The example that we saw earlier, Company A (all receivables), B (all cash), and C (all inventory), provide different interpretations.
- This ratio in isolation does not mean anything. It does not provide an insight on product profitability etc.
- This ratio can be manipulated by management. An equal increase in both current assets and current liabilities would decrease the ratio, and likewise, an equal decrease in current assets and current liabilities would increase the ratio.
Current Ratio Vs Quick Ratio
Let us compare the current ratio and the quick ratio, two important financial metrics that provide insights into a company’s liquidity. Here’s a concise breakdown of their differences.
Current Ratio
- Measures a company’s short-term liquidity and ability to meet immediate obligations.
- Includes all current assets, such as cash, accounts receivable, and inventory.
- The current ratio calculator provides a broader view of liquidity by considering inventory, which may not be as easily converted to cash in a pinch.
- Offers a more conservative assessment of a company’s ability to pay its short-term debts.
Quick Ratio
- The quick ratio, also referred to as the Acid-Test ratio, focuses on a company’s immediate liquidity, excluding inventory from current assets.
- Considers only the most liquid assets: cash, accounts receivable, and short-term investments.
- Provides a more stringent evaluation of a company’s short-term financial health, as it excludes assets that might not be readily convertible to cash.
- Useful for assessing how well a company can handle sudden financial crises or obligations without relying on inventory sales.
Recommended Articles
This has been a guide to the Current Ratio and its meaning. Here we explain its formula, how to calculate, examples, and compare it with quick ratio. You may learn more about financial analysis from the following articles –