What is the Empirical Rule?
An empirical rule in statistics states almost all (95%) of the observations in a normal distribution lie within three standard deviations from the mean. It is a very important rule and helps in forecasting. However, one should always note that these are approximations. There are always chances of outliers that don’t fall in the distribution.
It is a statistical concept that helps portray the probability of observations and is very useful when finding an approximation of a huge population. So, the findings are not accurate and precautionary measures should be taken when acting as per the forecast.
Key Takeaways
- An Empirical Rule in statistics mentions that approximately all (95%) observations in a normal distribution lie within three standard deviations from the mean. Therefore, it is an essential rule and helps in forecasting.
- One may use it in predicting dataset trends. However, when the data set is extensive, it gets challenging to analyze the whole population.
- The Empirical Rule is applied to data sets that use a normal distribution. That means bell-shaped.
- The Empirical Rule is a statistical concept that displays the probability of observations. Therefore, it is instrumental when finding an approximation of a vast population. However, one must never forget that these are approximations.
How Does Empirical Rule Work?
The empirical rule helps estimate the outcome and assess the extent to which the same would vary. It helps to have three levels of standard deviation to check the expected variations in the estimated outcome.
Data is like gold in the modern world. Huge data flow from different sources is used for different approximations or forecasts. For example, if a data set follows a normal distribution, it shows a bell shaped curve. Then, one can use the empirical rule. Finally, it is applied to observations to create an approximation for the population.
Once the observations show a normal distribution structure, one may follow an empirical rule to find several observations’ probabilities. The rule is extremely useful for many statistical forecasts.
Formula
The formula shows the predicted percentage of observations within each standard deviation from the mean.
The empirical rule formula works on the following specifications:
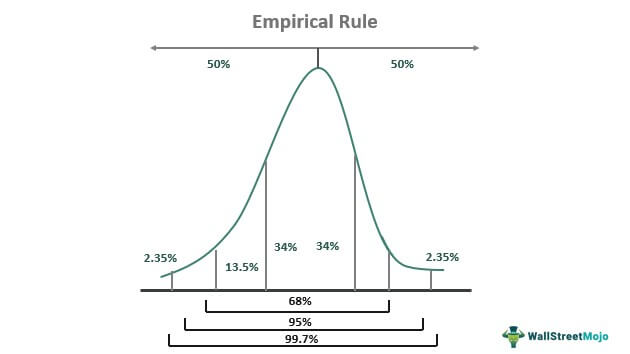
- 68% of the observations will lie within +/- 1 standard deviation from the mean
- 95% of the observations will lie within +/- 2 standard deviations from the mean
- 99.7% of the observations will lie within +/- 3 standard deviations from the mean
Examples
Let us check the example below to see how to calculate empirical rule possibilities:
Mr. X is trying to find the average number of years a person survives after retirement, considering the retirement age to be 60. If the mean survival years of 50 random observations are 20 years and SD is 3, then determine the probability that a person will draw a pension for more than 23 years.
Solution
The empirical rule states that 68% of the observations will lie within 1 standard deviation from the mean. Here, the mean of the observations is 20.
68% of the observations will lie within 20 +/- 1 (standard deviation), which is 20 +/- 3. So, the range is 17 to 23.
There is a 68% chance that the minimum number of years a person survives after retirement lies between 17 to 23. The percentage lying outside this range is (100 – 68) = 32%. Therefore, 32 is distributed equally on both sides, which means a 16% chance that the minimum years will be below 17 and a 16% chance that the minimum years will be greater than 23.
So, the probability that the person will draw more than 23 years of pension is 16%.
How to Use?
One may use it in the forecasting trend of a data set. When the data set is extensive, it gets challenging to study the entire population. For example, one can apply the empirical rule to the sample to get an estimation of how the data in the population will react if asked to find the average salary of all the accountants in the US. Then that is a difficult task to perform as the population set is enormous. So, in that case, you can select, say, 90 observations randomly from the entire population.
So now you will have 90 salaries. Next, you need to find the mean and standard deviation of the observations. If the observation follows a normal distribution, one can apply this, and one can estimate the salary of all accountants in the US.
Say the mean salary of the sample comes out to be $90,000. And the standard deviation is $5,000. Out of the entire population, 68% of the accountants are drawing a salary ranging between +/- 1 standard deviation from the mean. The mean is $90,000, and the standard deviation is $5,000. So as per the empirical rule in a normal distribution, 68% of all the accountants in the US paid in the range of $90,000 +/- (1*$5,000). That is within $85,000 to $95,000.
If we spread a bit more, then 95% of all the accountants in the US are being paid in the range of mean +/- 2 standard deviations. $90,000 +/- (2*5000). So the range is $80,000 to $100,000.
In a broader range, 99.7% of all accountants draw salaries ranging from mean +/- 3 standard deviations. That is 90,000 +/- (3*5000). The range is $75,000 to $105,000.
You can see that without studying the entire population, one could estimate the population. For example, if someone plans to work as an accountant in the US, he can easily expect his salary to range from $75,000 to $105,000.
This kind of estimation helps to ease work and make forecasts regarding the future.
Empirical Rule Vs Chebyshev’s Theorem
The empirical rule applies to data sets that follow a normal distribution. That means bell-shaped. In a normal distribution, both sides have a 50% probability each.
Chebyshev’s theorem applies another approximation or rule to all types of data sets if the data set is distributed not normally. It says three things:
- At least 3/4th of all the observations will lie within 2 standard deviations from the mean. It is a strong approximation. For example, it means if there are 100 observations, then 3/4th of the observations that are 75 observations will lie within +/- 2 standard deviations from the mean.
- At least 8/9th of all observations will lie within 3 standard deviations from the mean.
- At least 1 – 1/k^2 of all the observations lie within K standard deviations from the mean. Here, K is any whole number.
Frequently Asked Questions (FAQs)
When can you not use the Empirical Rule?
The Empirical Rule or the 68–95–99.7 can only be employed for a symmetric and unimodal distribution since it only applies to Normal Statistical Distributions.
What are the three percentages associated with the Empirical Rule?
The Empirical Rule states that 99.7% of data observed following a normal distribution is within three standard deviations of the mean. In this rule, 68% of the data is in one standard deviation, 95% percent in two standard deviations, and 99.7% within three standard deviations from the mean.
On which population distributions can the Empirical Rule be used?
The Empirical Rule applies to a normal distribution. In a normal distribution, virtually all data fall within three standard deviations of the mean. Moreover, the mean, mode, and median are all equal.
When can the Empirical Rule be used in binomial experiments?
One can use the Empirical Rule to identify results in binomial experiments when np(1-p) is greater than or equal to 10.
Recommended Articles
This article has been a guide to what is Empirical Rule. Here we explain it with formula, discuss how to use it along with examples, and vs Chebyshev’s Theorem. You can learn more about it from the following articles: –