What is Normal Distribution Formula?
The normal distribution is symmetric, i.e., one can divide the positive and negative values of the distribution into equal halves; therefore, the mean, median, and mode will be equal. It has two tails. One is known as the right tail, and the other one is known as the left tail.
The normal distribution formula calculator gives the analyst a distribution of data points where majority of the data points converge at the middle and the rest keep spreading towards the extremes of the graph. It is also referred to as Gaussian distribution that appears as a bell curve when charted on a graph.
Key Takeaways
- The normal distribution is symmetric; one may divide the positive and negative distribution values into equal halves. Therefore, the mean, median, and mode will be similar.
- It has two tails: a right tail and a left tail.
- A distribution is normal when it follows a bell curve as it takes the shape of a bell.
- It is an essential statistical concept since significant random financial variables follow such a curve. It plays a vital part in constructing portfolios. Apart from finance, many real-life parameters follow the distribution.
Normal Distribution Formula Explained
A normal distribution formula calculation follows a bell curve. It is known as the bell curve as it takes the shape of the bell. One of the most important characteristics of a normal curve is that it is symmetric, which means one can divide the positive and negative values of the distribution into equal halves. Another essential characteristic of the variable is that the observations will be within 1 standard deviation of the mean 90% of the time. The observations will be two standard deviations from the mean 95% of the time and within three standard deviations from the mean 99% of the time.
Formula
The formula for the calculation represents as follows:
X ~ N (µ, α)
Where
- N= no of observations
- µ= mean of the observations
- α= standard deviation
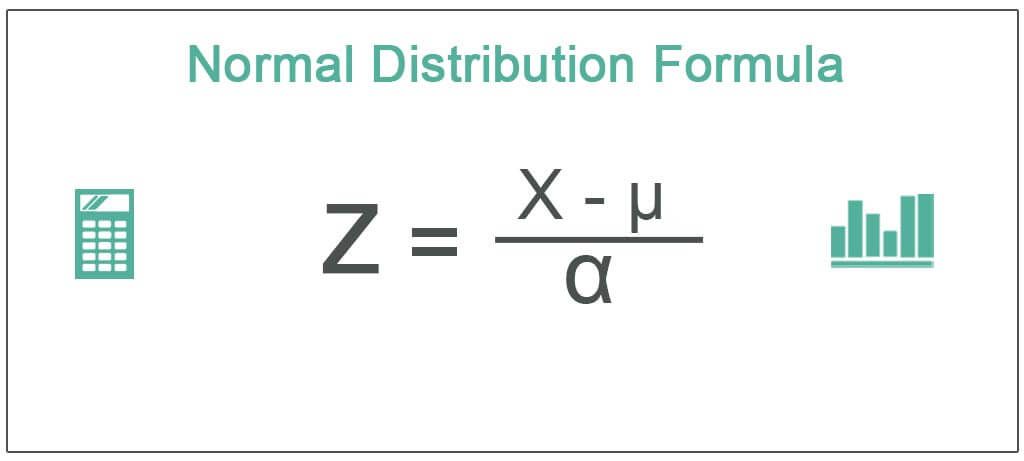
In most cases, the observations do not reveal much in their raw form. So, it is essential to standardize the observations to compare that. One can do it with the help of the z-score formula. It is required to calculate the Z-score for an observation.
The equation for Z-score calculation for the normal distribution represents as follows:
Where
- Z= Z-score of the observations
- µ= mean of the observations
- α= standard deviation
Examples
Let us understand the normal distribution formula probability with the help of a couple of examples.
Example #1
The mean of the weights of a class of students is 65kg, and the standard of the weight is .5 kg. If we assume that the distribution of the return is normal, then let us interpret for the weight of the students in the class.
When a distribution is normal, then 68% of it lies within 1 standard deviation, 95% lies within 2 standard deviations, and 99% lies within 3 standard deviations.
Given,
- The mean return for the weight will be 65 kgs
- The standard deviation will be 3.5 kgs
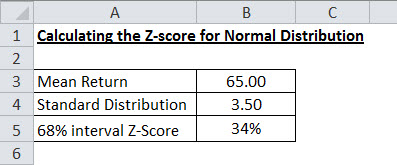
So, 68% of the time, the value of the distribution will be in the range below,
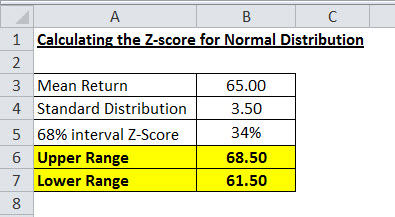
- Upper Range = 65+3.5= 68.5
- Lower Range = 65-3.5= 61.5
- Each tail will (68%/2) = 34%
Example #2
Let’s continue with the same example. The mean of weight of a class of students is 65kg, and the standard of weight is 3.5 kg. If we assume that the distribution of the return is normal, then let us interpret it for the weight of the students in the class.
Given,
- The mean return for the weight will be 65 kg
- The standard deviation will be 3.5 kg
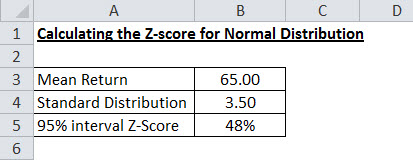
So, 95% of the time, the value of the distribution will be in the range as below,
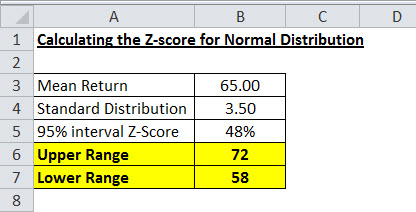
- Upper Range =65+(3.5*2)= 72
- Lower Range = 65-(3.5*2)= 58
- Each tail will (95%/2) = 47.5%
Example #3
Let’s continue with the same example. The mean of the weights of a class of students is 65kg, and the standard of weight is 3.5 kg. If we assume that the distribution of the return is normal, then let us interpret it for the weight of the students in the class.
Given,
- The mean return for the weight will be 65 kgs
- The standard deviation will be 3.5 kgs
So, 99% of the time, the value of the distribution will be in the range as below,
- Upper Range = 65+(3.5*3)= 75.5
- Lower Range = 65-(3.5*3)= 54.5
- Each tail will (99%/2) = 49.5%
Relevance and Uses
Let us understand the relevance and uses of the normal distribution formula calculation through the discussion below.
The normal distribution is an essential statistical concept as most of the random variables in finance follow such a curve. It plays an important part in constructing portfolios. Apart from finance, a lot of real-life parameters are to be following such a distribution. For example, if we try to find the height of students in a class or the weight of the students, the observations are normally distributed. Similarly, the marks of an exam also follow the same distribution. It helps to normalize marks in an exam if most students score below the passing marks by setting a limit of saying only those who failed who scored below two standard deviations.
Frequently Asked Questions (FAQs)
Which normal distribution has a broader spread?
The normal distribution with a mean of 1 and a standard deviation of 3 is more comprehensive than a distribution with a mean of 3 and a standard deviation of 1.
What is x in the normal distribution formula?
The data points are called x in a normal distribution. A Z-score is a standard score that shows how many standard deviations away from the mean an individual value (x) lies: A positive Z-score means that the x value is greater than the mean.
Does normal distribution have outliers?
Normal distribution data can have outliers. Well-known statistical techniques detect outliers (anomalies) in a data set, assuming that a Gaussian distribution creates the data.
Does normal distribution have to be symmetrical?
Normal distributions are symmetrical, but not every balanced distribution is normal. Many natural events tend to inexact the normal distribution.
Recommended Articles
This article is a guide to the what is Normal Distribution Formula. Here we explain the formula to calculate along with examples, relevance, and uses. You can learn more about financing from the following articles: –