What is the Confidence Interval Formula?
The confidence interval assesses the level of uncertainty with specific statistics and is employed along with the margin of error. The confidence interval selection for a given interval computes the probability that the resulting confidence interval would contain the true parameter value.
Confidence intervals are inherently related to confidence levels. It is determined using normal distribution, T-distribution, and proportions. A true population parameter is a value representing the specific population’s characteristics. The confidence interval equation in general form represents as follows: –
Confidence Interval Formula = Mean of Sample ± Critical Factor × Standard Deviation of Sample
Explanation of the Confidence Interval Formula
One can calculate the confidence interval equation by using the following steps:
Step 1: Firstly, determine the criteria or phenomenon to be taken up for testing. It will see how close the predictions would lie concerning the chosen criterion.
Step 2: Next, from the population, shortlist or choose the sample from it. The data gathered or the sample formulated would be utilized to test or perform the hypothesis.
Step 3: Next, determine the mean and standard deviation for the sample chosen. It would help determine the population parameter.
Step 4: Next, determine the confidence level. The confidence level may range from 90 percent to 99 percent. For example, If the confidence level chooses 95 percent, it is inferred that the analyst is sure 95 percent of the parameter in the sample chosen.
Step 5: Now, determine the confidence coefficient for the confidence interval chosen for the determination of confidence interval. To determine the confidence level value’s confidence coefficient, refer to the corresponding table for the coefficient. For example, suppose the confidence coefficient is determined using z-tables wherein the analyst can refer to the table to arrive at the critical value or the coefficient.
Step 6: Now, determine the margin of error. The margin of error is displayed below: –
The margin of Error = Critical Factor × Standard deviation of the sample.
- Margin of Error = Za/2 × σ/√(n)
Here,
- The critical value of the sample is represented as Za/2.
- The sample size is represented as n.
- The standard deviation is represented as σ.
Step 7: Now, determine the confidence interval for the chosen sample with the confidence level. The confidence interval formula is displayed below:-
Confidence Interval=Mean of Sample ± Critical Factor × Standard deviation of the Sample.
Examples of Confidence Interval Formula
Let’s see some simple to advanced practical examples of the confidence interval equation to understand it better.
Confidence Interval Formula – Example #1
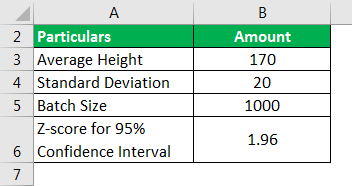
Let us take the example of a university assessing the average height of students on board with the university. The management determined the average height of the students undertaken in the batch is 170 cm. The batch strength is 1,000 students, and the standard deviation among the students is broadly 20 cm.
Help the university management determine the confidence interval on the average height of the students on board with the university. For example, assume the confidence level to be at 95 percent.
Use the below-given data for the calculation of the confidence interval.
Calculation of margin of error using the below formula is as follows:
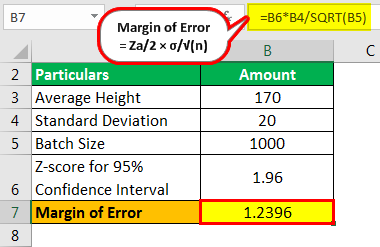
- Margin of Error = Za/2 × σ/√(n)
- = 1.96 × 20/√ (1,000)
- = 1.96 × 20/31.62
- = 1.96 × 0.632
- Margin of Error = 1.2396
Calculation of confidence interval at level 1
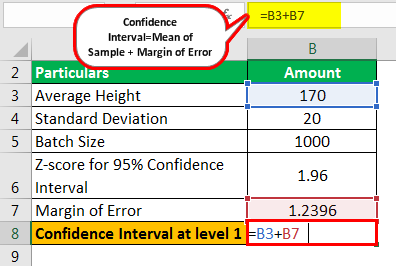
Confidence Interval=Mean of Sample ± Margin of Error
=170 ± 1.2396
Confidence value = 170 + 1.2396
Confidence Interval at level 1 will be –
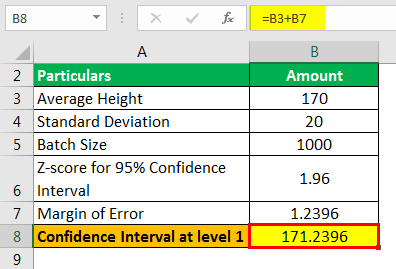
- Confidence Interval value at level 1 = 171.2396
Calculation of confidence interval at level 2
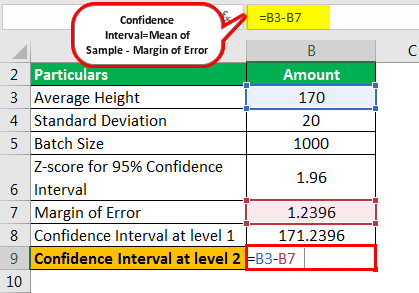
=Confidence value = 170 – 1.2396
Confidence Interval at level 2 will be –
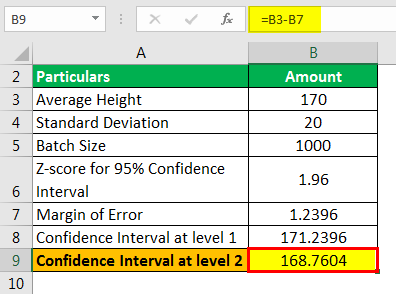
- Confidence Interval Value at level 2 = 168.7604
Therefore, the confidence interval for the average height of students is 168.7604 cm to 171.2396 cm.
Confidence Interval Formula – Example #2
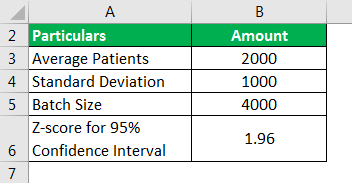
Let us take the example of a hospital that is trying to assess the confidence interval on the number of patients received by it during the month. The management determined that the average number of patients received for the month was 2,000. The hospital has a capacity of 4,000 patients, and the standard deviation among the students is broadly at 1000 individuals.
Help the university management determine the confidence interval on the average height of the students on board with the university. For example, assume the confidence level to be at 95 percent.
Use the below-given data for the calculation of the confidence interval.
Calculation of margin of error using below formula is as follows:
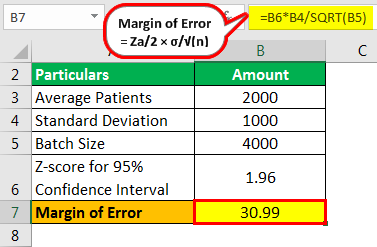
- Margin of Error = Za/2 × σ/√(n)
- = 1.96 × 1,000/√ (4,000)
- = 1.96 × 1,000/ 63.25
- = 1.96 × 15.811
- Margin of Error = 30.99
Calculation of confidence interval at level 1
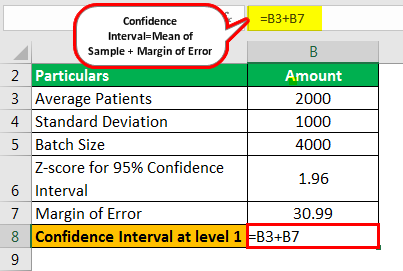
Confidence Interval=Mean of Sample ± Margin of Error
- Confidence Interval=2,000 ± 30.99
- Confidence Value = 2,000 + 30.99
Confidence Interval at level 1 will be –
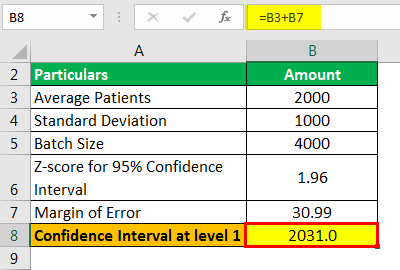
- Confidence Interval Value at level 1 = 2031.0
Calculation of confidence interval at level 2
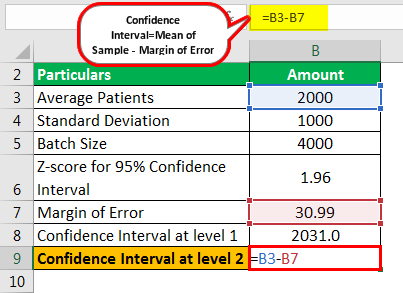
- = Confidence value = 2000 – 30.99
Confidence Interval at level 2 will be –

- Confidence Interva Value at level 2 = 1969.0
Therefore, the confidence interval for the average number of patients received by the hospital is from 1969 individuals to 2,031 individuals.
Relevance and Uses
The application of the confidence interval provides a series of values for the population undertaken rather than the estimate of point or a single value. It further helps in determining that the confidence interval may not contain the value or estimate being looked upon. Still, the probability of finding that specific estimate would be more than the probability of not finding that specific estimate from the range of values chosen in the confidence interval.
For each confidence interval, it is necessary to choose the confidence level for determining whether the estimate lies in the confidence level. For example, a confidence level could be 90%, 95%, or 99%. However, for most of the analysis, a confidence level of 95 percent is further used to determine the confidence coefficient and, thereby, the confidence interval.
Confidence Interval Formula in Excel (with Excel Template)
Now, let us take the Excel example to illustrate the concept of the confidence interval in the Excel template below. Let us further consider example 1 in Excel to illustrate the concept of a confidence interval formula. Finally, the table provides a detailed explanation of the confidence interval:
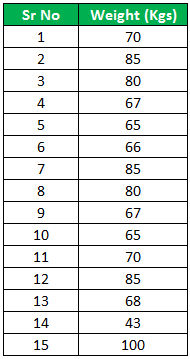
Similarly, A cricket team is trying to determine the confidence level of the average weight of the players in the squad. The squad has a sample size of 15 members. Assume the confidence level to be at 95 percent. For a confidence level of 95 percent, the confidence coefficient is determined at 1.96. The sample size for the analysis is displayed below.
The first step involves the determination of the average weight of the sample as displayed below: –
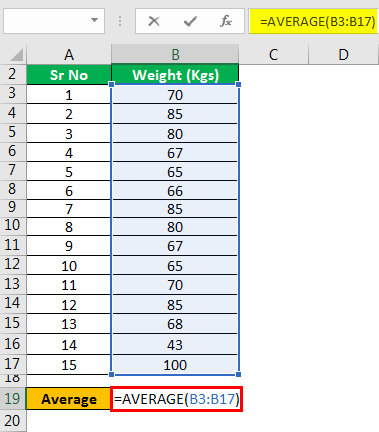
The following would be the results of the above calculation: –
Average
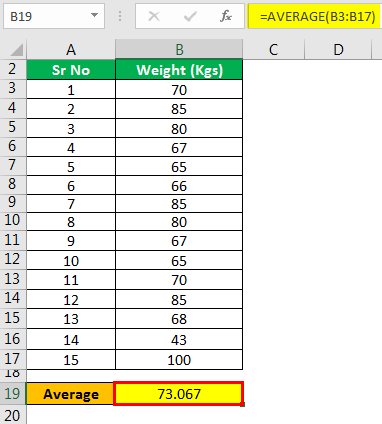
- Average = 73.067
The second step involves the determination of the standard deviation on the weight of the sample as displayed below: –
STDEV
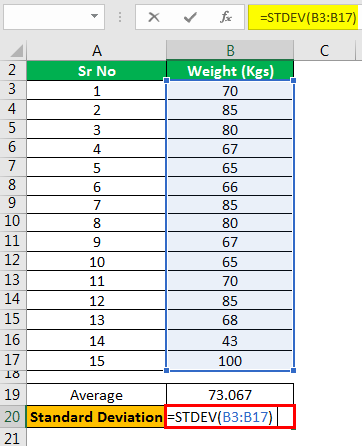
The following would be the results of the above calculations: –
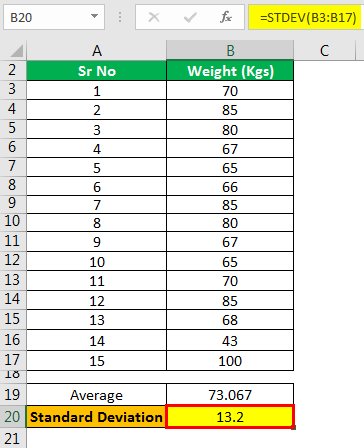
- STDEV (Standard Deviation) = 13.2
The third step involves the determination of the margin on an error in the weight of the sample below: –
Margin of Error
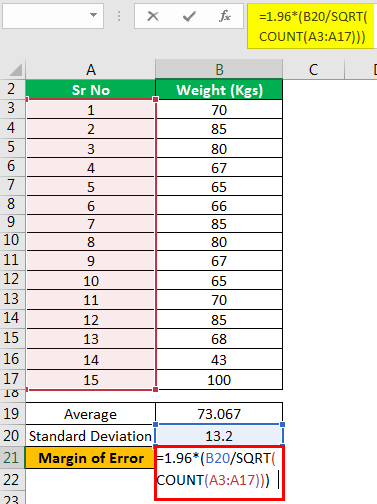
The following would be the results of the above calculations: –
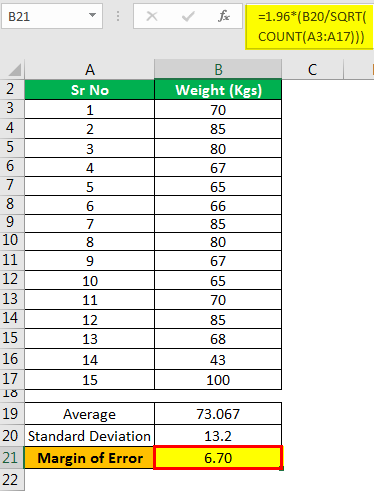
- Margin of Error = 6.70
Finally, determine the confidence interval as displayed below: –
Calculation of Confidence Interval at level 1
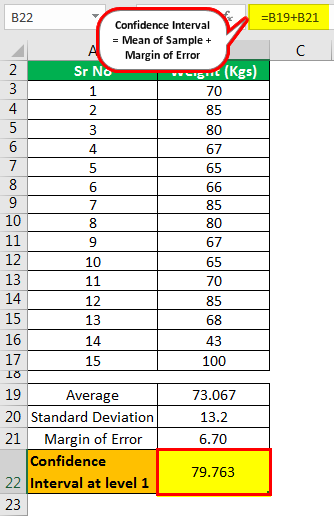
Confidence Interval = Mean of Sample ± Margin of Error
Confidence Interval=73.067 ± 6.70
- =73.067+6.70
- =79.763
Calculation of Confidence Interval at level 2 –
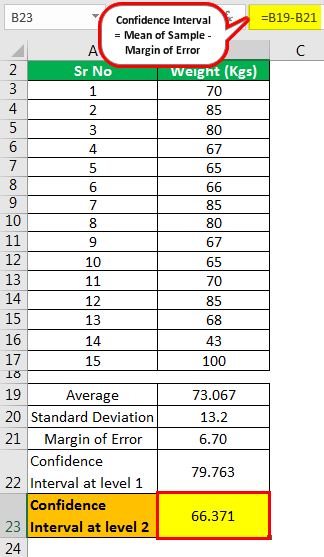
- =73.067-6.70
- =66.371
Therefore, as determined by the management, the confidence interval for the average weight of cricketers in the squad is 79.763 individuals to 66.371 individuals.
Recommended Articles
This article has been a guide to the Confidence Interval Formula. Here, we provide step-by-step calculations of confidence intervals in Excel, practical examples, and a downloadable Excel template. You can learn more about accounting and budgeting from the following articles: –