Bell Curve Meaning
A bell curve is a normal probability distribution of variables plotted on the graph and is like a bell shape where the highest or top point of the curve represents the most probable event out of all the series data. . It is also called the normal distribution, and the graph is in the shape of a bell.
In this statistical process of data distribution, the chart represents the mean, median, and mode of the data set. It is used in a variety of fields, which include finance, economics, statistics, and social science. It helps analysts understand the distribution of information and make future forecasts based on observed patterns.
How Does It Work?
A bell curve refers to a graph that depicts a normal probability distribution of a set of data. The curve is in the shape of a bell and is due to the standard deviation, which is the deviation from the mean of the dataset.
This kind of graphical representation shows a symmetrical bell shape displaying the mean, the median, and the mode. The data concentration on a bell curve normal distribution is more at the peak and it reduces on the sides. The peak is the point where the probability of occurrence is the highest. The peak also shows the mean value.
The dispersion on the curve is calculated using the standard deviation. There are some essential points to be noted regarding the relation between the standard deviation and the probability distribution. It is necessary to understand that about 68% of the overall data is within 1 standard deviation, around 95% of the overall data is within 2 standard deviations and around 99.7% of the overall data is within 3 standard deviations.
The above is also called the empirical rule and is an integral part of the calculation of the confidence interval in the probability distribution of statistical calculation. This concept is very widely used in the statistical field and has gained a lot of importance over the years.
In the financial world, the bell curve normal distribution curve has a lot of significance. Analysts and investors frequently use the normal probability distribution for return analysis and estimation of securities. This is useful in future predictions for investment. However, it is necessary to understand the type of security and its pricing trends and then use this method because the predictions using this method don’t always need to be accurate or suitable for all financial instruments.
Formula
The formula for the bell curve is as per below:
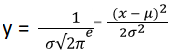
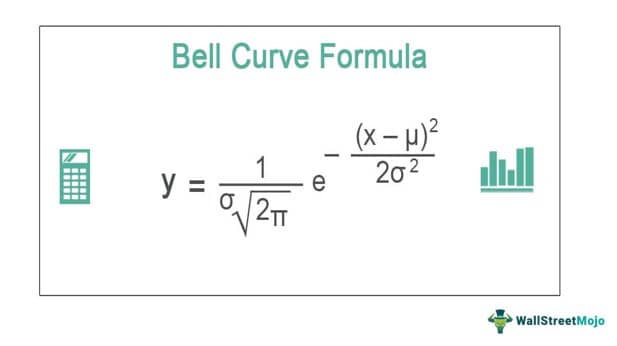
Where,
- μ is mean
- σ is a standard deviation
- π is 3.14159
- e is 2.71828
- The mean denotes μ, which denotes the distribution’s center or midpoint.
- The horizontal symmetry about the vertical line is x = μ as there is a square in the exponent.
- The standard deviation denotes by σ and is related to the spread of the distribution. As σ increases, the normal distribution will spread out more. Specifically, the distribution’s peak is not as high, and the distribution’s tail shall become thicker.
- π is constant pi and has an infinite, not repeating decimal expansion.
- E represents another constant and is also transcendental and irrational, like pi.
- The exponent has a non-positive sign, and the rest of the terms are squared. So it means the exponent will always be negative. And because of that, the function increases for all x < mean μ. The opposite is true when all x > mean μ.
- Another horizontal asymptote corresponds to the horizontal line y, which equals 0, meaning that the function’s graph will never touch the x-axis and will have a zero.
- The square root in the excel term will normalize the formula, which means that when one integrates the function for searching the area under the curve where the whole area will be under the curve, it is one, corresponding to 100%.
- This formula is related to a normal distribution used for calculating probabilities.
Graph
Let us look at the graph of the bell curve shape statistical concept, its shape, and specific pattern in detail from the figure below:
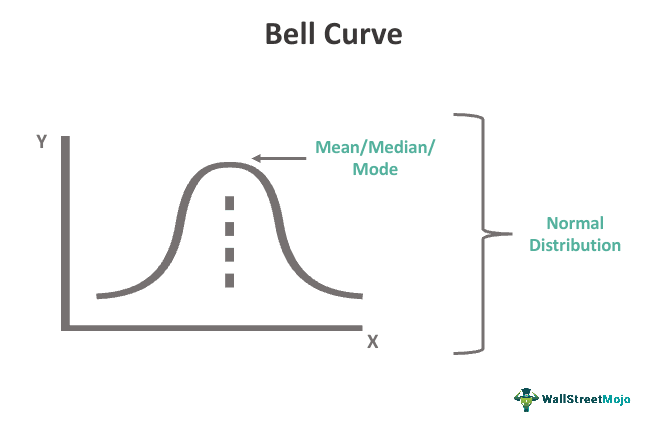
As we can see from the picture, it is symmetric in shape, which means that the right side of the curve mirrors the image of the left side. The peak of the graph shows the concentration of the mean of the data. The width of the graph determines the standard deviation. The lower part of the bell curve shape indicates more standard deviation. Hence the variability or width is more, which reduces as the curve goes up. This bell shaped graph is being widely used in different fields of statistical study.
Examples
Let us understand the concept of bell curve graph with the help of some suitable examples.
Example #1
Consider the mean given to you, like 950, the standard deviation of 200. Then, it would help if you calculated y for x = 850 using the bell curve equation.
Solution:
Use the following data for the calculation.
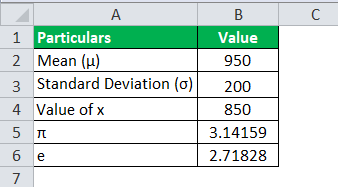
First, we have all the values, i.e., mean as 950, standard deviation as 200, and x as 850. Then, we need to plug in the figures in the formula and calculate the y.
The formula for bell-shaped curve as per below:
y = 1/(200√2*3.14159)^e-(850 – 950)/2*(200^2)
y will be –
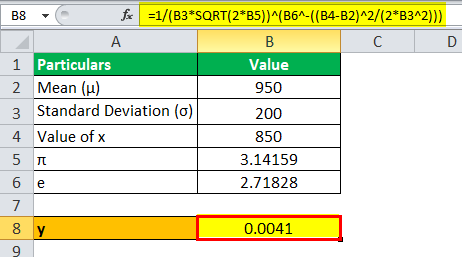
y = 0.0041
After doing the above math (check the Excel template), we have the value of y as 0.0041.
Example #2
Sunita is a runner preparing for the upcoming Olympics and wants to determine that the race she will run has perfect timing calculations as a split delay can cause her the gold in Olympics. Her brother is a statistician, and he noted that the mean timing of her sister is 10.33 seconds, whereas the standard deviation of her timing is 0.57 seconds, which is quite risky as such a split delay can cause her to win gold in the Olympics. So, using the bell-shaped curve equation, what is the probability of Sunita completing the race in 10.22 seconds?
Solution:
Use the following data for the calculation.

First, we have all the values, i.e., mean as 10.33 seconds, standard deviation as 0.57 seconds, and x as 10.22. Then, we just need to plug in the figures in the formula and calculate the y.
The formula for the bell curve is as per below:
y = 1/(0.57√2*3.14159)^e-(850 – 950)/2*(200^2)
y will be –
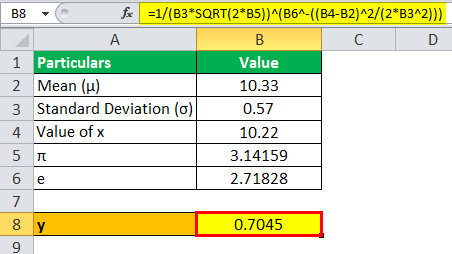
y = 0.7045
After doing the above math (check the Excel template), we have the value of y as 0.7045.
Example #3
Hari-baktii Ltd. is an audit firm. It has recently received a statutory audit from ABC bank. They have noted that in the last few audits, they picked up an incorrect sample that misrepresented the population. For example, the sample they picked up depicted that they were genuine in the case of receivables. Still, later they discovered that the receivable population had many dummy entries.
So now, they are trying to analyze the probability of picking up the bad sample, which would generalize the population as correct even though the sample was not a correct representation of that population. They have an article assistant who is good at statistics, and recently he has learned about the bell curve equation.
So, he decides to use that formula to find the probability of picking up at least seven incorrect samples. He went into the firm’s history and found that the average incorrect sample they collect from a population is between 5 to 10, and the standard deviation is 2.
Solution:
Use the following data for the calculation.
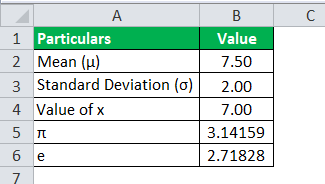
First, we need to take the average of the two numbers given, i.e., for mean as (5+10)/2, which is 7.50, standard deviation as 2, and x as 7. Then, we just need to plug in the figures in the formula and calculate the y.
The formula for the bell curve is as per below:
y = 1/(2√2*3.14159)^e-(7 – 7.5)/2*(2^2)
y will be –
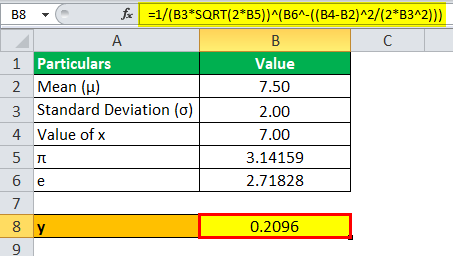
y = 0.2096
After doing the above math (check the Excel template), we have the value of y as 0.2096.
So, there is a 21% chance that they could also take 7 incorrect samples in the audit this time.
Disadvantages
Let us look at the disadvantages of the concept of bell curve graph in detail, as given below:
- It assumes that the distribution is normal, and the data pattern is symmetrical in nature, creating the bell. This is not always the case in the real world.
- There may be extreme outliers or values that deviate a lot from the mean. In such cases, this distribution may not be very suitable and may not display the distribution accurately.
- In case of complicated systems of complex data sets that have the influence of many factors, dependence on normal distribution and bell curve distribution may lead to biasness.
- From the above points it can be derived that it has the limitation of using only certain types of data sets from analysis, making its predictive power limited. It will not be able to capture extreme occurrences.
- Forcibly using the bell curve to represent data for which it is not a good fit will actually misrepresent the data, leading to inaccurate predictions and forcasting.
It is necessary to keep the above disadvantages in mind before selecting this method so that it can be applied in suitable areas of analysis to get the desired results.
Relevance And Uses
One will use this function to describe the physical events, i.e., the number of events is humongous. In simple words, one may not be able to predict the outcome of the item if there are a ton of observations, but one shall be able to predict what those shall do as a whole. For example, suppose one has a gas jar at a constant temperature. Then, the normal distribution or the bell curve will enable that person to figure out the probability of one particle moving at a specific velocity.
The financial analyst will often use the normal probability distribution or the bell curve while analyzing the returns of overall market sensitivity or security.
E.g., stocks that display a bell curve are usually the blue-chip ones, and those shall have the lower volatility and often more behavioral patterns which shall be predictable. Hence, they use the normal probability distribution or bell curve of a stock’s previous returns to make assumptions about the expected returns.
Bell Curve Vs Gaussian
Both the above terms are actually used interchangeably since they depict the same statistical pattern of data distribution. However, there some very small differences between them, which are as given below:
- The bell curve distribution is a more of a general terminology that describes any symmetrical concept in statistics that is in the shape of a bell, whereas in case of the latter, the shape of the curve is the same but it is a normal distribution with a more mathematical basis.
- The former does not necessarily specify any mathematical origin, but the latter does.
- The latter was named after the mathematician Carl Friedrich Gauss, which is not the case for the former.
Thus, apart from the above minor differences, it can be said that both the concepts are almost the same.
Recommended Articles
This article is a guide to Bell Curve and its definition. Here we learn how to create a bell-shaped graph (y) using its formula, practical examples, and a downloadable Excel template. You can learn more about financial analysis from the following articles: –