Framework For Ratio Analysis
Ratio analysis of financial statements is another tool that helps identify changes in a company’s financial situation. A single ratio is not sufficient to adequately judge the financial situation of the company. Several ratios must be analyzed together and compared with prior-year ratios, or even with other companies in the same industry. This comparative aspect of the analysis is extremely important in financial analysis. It is important to note that ratios are parameters and not precise or absolute measurements. Thus, ratios must be interpreted cautiously to avoid erroneous conclusions.
An analyst should attempt to get behind the numbers, place them in their proper perspective, and, if necessary, ask the right questions for further types of ratio analysis. However, to become an analyst, one must be aware of the nitty-gritty of ratio analysis. Hence, before you dive deeper into the concept further, you must quickly check out this Ratio Analysis Course.
Key Takeaways
- Ratio analysis meaning refers to a process that involves analyzing the financial statements of a company to gain key insights into profitability, solvency, liquidity, and efficiency.
- Ratio analysis offers various benefits. For example, it helps assess a company’s liquidity position and assists in evaluating the profit capacity. Moreover, this type of analysis helps analyze an organization’s operational performance.
- There are different types of financial ratios, for example, turnover ratios, profitability ratios, and solvency ratios.
- A noteworthy limitation of this type of analysis is the high risk of false interpretations due to the inability to adjust to seasonal effects.
#1 – Vertical Analysis
What is Vertical Analysis?
Vertical analysis is a technique used to identify where a company has applied its resources and in what proportions those resources are distributed among the various balance sheets and income statement accounts. The analysis determines the relative weight of each account and its share in asset resources or revenue generation
Vertical Analysis – Income Statement
- On the income statement, vertical analysis is a universal tool for measuring the firm’s relative performance from year to year in terms of cost and profitability.
- It should always be included as part of any financial analysis. Here, percentages are computed in relation to Sales, which are considered to be 100%.
- This vertical analysis effort in the income statement is often referred to as margin analysis since it yields different margins in relation to sales.
- It also helps us do the time series analysis ( how the margins have increased/decreased over the years) and also helps in cross-sectional analysis with other comparable companies in the industry.
Colgate Case Study
- For each year, Income Statement line items are divided by their respective year’s Top Line (Net Sales) number.
- For example, for Gross Profit, it is Gross Profit / Net Sales. Likewise for other numbers

What can we interpret with Vertical Analysis of Colgate?
- Vertical Ratio Analysis helps us with analyzing historical trends.
- Please note that from vertical analysis, we only get to the point of asking the right questions (identification of problems). However, we do not get answers to our questions here.
- In Colgate, we note that the gross profit margin (Gross Profit / Net Sales) has been in the range of 59.4% to 60.8%. Why almost constant?
- We also note that the Selling General and administrative expense (SG&A) have increased from 33.8.1% in 2016 to 36.5% in the year ending 2020. Why?
- Also, note that the operating income dropped significantly in 2019. Why?
- Net income increased to less than 16.4%. Why?
- Also, effective tax rates are decreasing over the years (from 30.8% in 2016 to 21.6% in 2020). Why?
Ratio Analysis Explained in Video

#2 – Horizontal Analysis
What is Horizontal Analysis?
Horizontal analysis is a technique used to evaluate trends over time by computing percentage increases or decreases relative to a base year. It provides an analytical link between accounts calculated at different dates using the currency with different purchasing powers. In effect, this analysis indexes the accounts and compares the evolution of these over time.
As with the vertical analysis methodology, issues will surface that need to be investigated and complemented with other financial analysis techniques. The focus is to look for symptoms of problems that can be diagnosed using additional techniques. Let’s look at an example.
Colgate Case Study
We calculate the growth rate of each of the line items with respect to the previous year.
For example, to find the growth rate of Net Sales of 2020, the formula is (Net Sales 2020 – Net Sales 2019) / Net Sales 2019
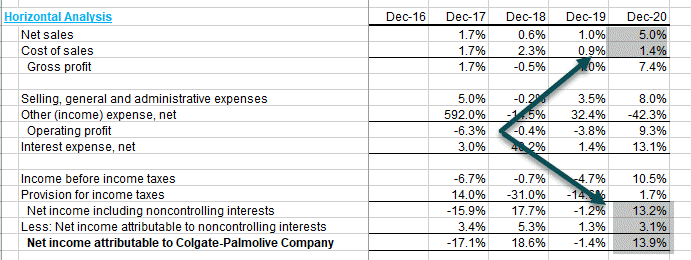
What can we interpret with Horizontal Analysis of Colgate Palmolive?
- In 2020, Colgate’s new sales growth increased by 5%. Why?
- The Cost of Sales growth, however, has decreased (positive from the company’s point of view). Why is this so?
- Net Income growth increased in 2020. Why?
#3 – Trend Analysis
What is Trend Analysis?
Trend Analysis compares the overall growth of key financial statement line items over the years from the base case.
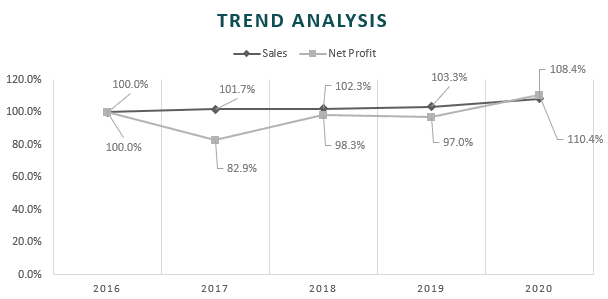
Colgate Case Study
For example, in the case of Colgate, we assume that 2016 is the base case and analyze the performance in Sales and Net profit over the years.
- We note that Sales have increased by only 8.4% over a period of 4 years (2016-2020).
- We also note that the overall net profit has increased by 10.4% over the 4 year period.
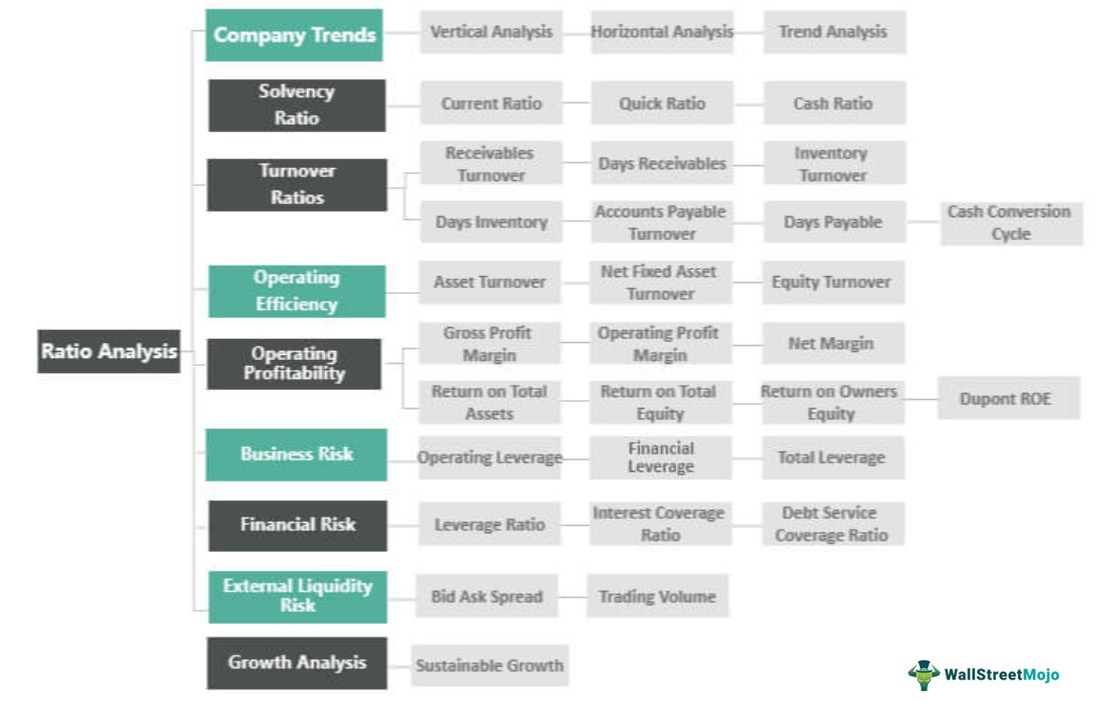
#4 – Solvency Ratio Analysis
Solvency Ratio Analysis type is primarily sub-categorized into two parts – Liquidity Analysis and Turnover Analysis of financial statement. They are further sub-divided into 10 ratios, as seen in the diagram below.
We will discuss each subcategory one by one.
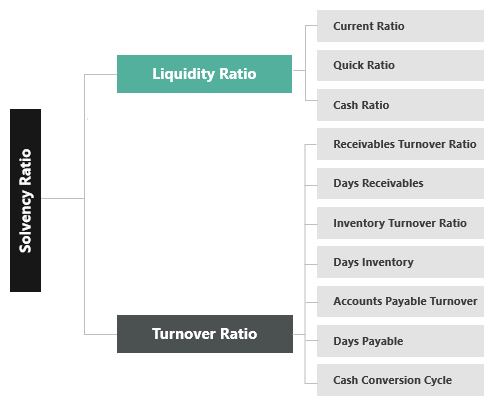
Liquidity ratio analysis measure how liquid the company’s assets are (how easily can the assets be converted into cash) as compared to its current liabilities. There are three common liquidity ratio
- Current analysis
- Acid test (or quick asset) ratio
- Cash Ratio
#5 – Current Ratio
What is the Current Ratio?
The current ratio is the most frequently used ratio to measure the company’s liquidity as it is a quick, intuitive, and easy measure to understand the relationship between the current assets and current liabilities. It basically answers this question “How many dollars in current assets does the company have to cover each $ of current liabilities.”
Formula
Current Ratio Formula = Current Assets / Current Liabilities
Example
Let us take a simple Current Ratio Calculation example,
- Current Assets = $200 Current Liabilities = $100
- Current Ratio = $200 / $100 = 2.0x
This implies that the company has two dollars of current assets for every one dollar of current liabilities.
Analyst Interpretation
- The current ratio provides us with a rough estimate of whether the company would be able to “survive” for one year or not. If Current Assets are greater than Current Liabilities, we interpret that the company can liquidate its current assets and pay off its current liabilities and survive at least for one operating cycle.
- The current Ratio in itself does not provide us with full details of the quality of current assets and whether they are fully realizable.
- If the current assets consist primarily of receivables, we should investigate the collectability of such receivables.
- If current assets consist of large Inventories, then we should be mindful of the fact that inventories will take longer to convert into cash as they cannot be readily sold. Inventories are much less liquid assets than receivables.
- The average maturities of current assets and current liabilities should also be looked into. If current liabilities mature in the next one month, then-current assets providing liquidity in 180 days may not be of much use.
Colgate Case Study
Let us now calculate the Current Ratios for Colgate.
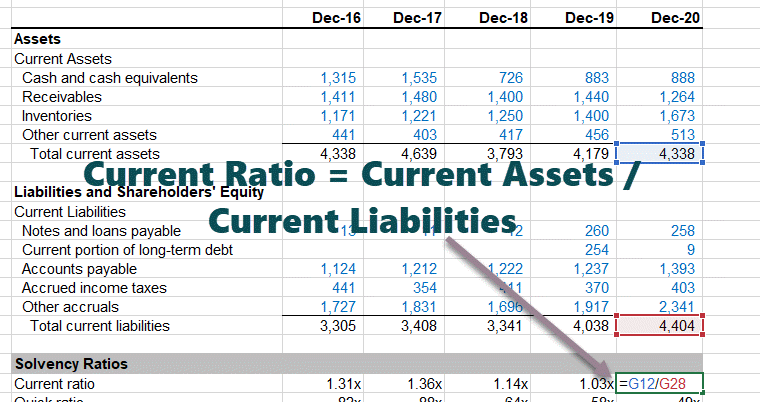
- Colgate’s current ratio has deteriorated over the past 5 years. Its current ratio of 2020 was at 0.99x
- This implies that Colgate’s current assets are almost equal to its current liabilities.
- We will still need to investigate the quality and liquidity of Current Assets. We note that around 45% of current assets in 2020 consists of Inventories and Other Current Assets. This may affect the liquidity position of Colgate.
- When investigating Colgate’s inventory, we note that the majority of the Inventory consists of Finished Goods (which is better in liquidity than raw materials supplies and work-in-progress).
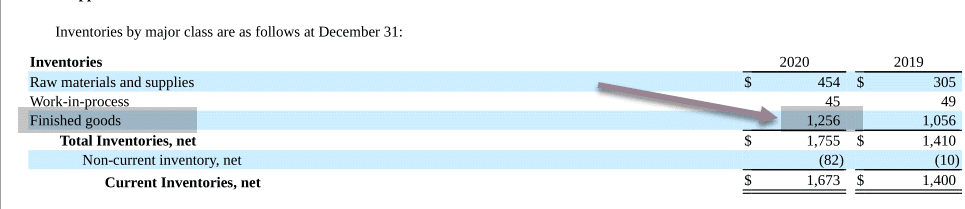
source: Colgate 2020 10K Report, Pg – 125
#6 – Quick Ratio Analysis
What is a Quick Ratio?
Sometimes current assets may contain huge amounts of inventory, prepaid expenses, etc. This may skew the current ratio interpretations as these are not very liquid. To address this issue, if we consider the only most liquid assets like Cash and Cash equivalents and Receivables, then it should provide us with a better picture of the coverage of short-term obligations. This ratio is known as the Quick Ratio or the Acid Test.
The rule of thumb for a healthy acid test index is 1.0.
Formula
Quick Ratio Formula = (Cash and Cash Equivalents + Accounts Receivables)/Current Liabilities
Example
Let us take a simple Quick Ratio Calculation example,
- Cash and Cash Equivalents = $100
- Accounts Receivables = $500
- Current Liabilities = $1000
Then Quick Ratio = ($100 + $500) / $1000 = 0.6x
Analyst Interpretation
- Accounts Receivables are more liquid than inventories.
- This is because Receivables directly convert into cash after the credit period; however, Inventories are first converted to Receivables, which in turn take further time to convert into cash.
- In addition, there can be uncertainty related to the true value of the inventory realized as some of it may become obsolete, prices may change, or it may become damaged.
- It should be noted that a low quick ratio may not always mean liquidity issues for the company. You may find low quick ratios in businesses that sell on a cash basis (for example, restaurants, supermarkets, etc.). In these businesses, there are no receivables; however, there may be a huge pile of inventory.
Colgate Case Study
Let us now look at the Quick Ratio Interpretation in Colgate.
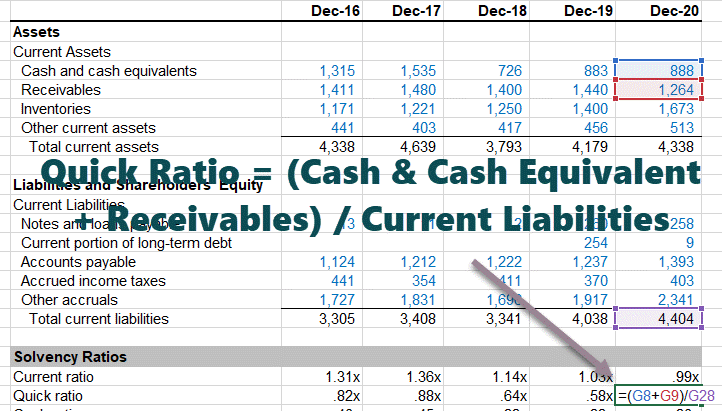
The Quick Ratio of Colgate is also decreasing (similar to the current ratio). This acid test shows us the company’s ability to pay off short-term liabilities using Receivables and Cash & Cash Equivalents.
If Individuals wish to enhance their knowledge of financial ratios, like current and liquidity ratios, they can take the Financial Planning & Analysis Course. The course covers ratio analysis in detail with the help of examples to help build a practical understanding.
#7 – Cash Ratio Analysis
What is the Cash Ratio?
The Cash Coverage ratio considers only the Cash and Cash Equivalents (there are the most liquid assets within the Current Assets). If the company has a higher cash ratio, it is more likely to be able to pay its short-term liabilities.
Formula
Cash Ratio Formula = Cash & Cash equivalents / Current Liabilities
Example
Let us take a simple Cash Ratio Calculation example,
- Cash and Cash Equivalents = $500
- Current Liabilities = $1000
Then Quick Ratio = $500 / $1000 = 0.5x
Analyst Interpretation
- All three ratios – Current Ratios, Quick Ratios, and Cash Ratios should be looked at for understanding the complete picture of the Company’s liquidity position.
- The cash Ratio is the ultimate liquidity test. If this number is large, we can obviously assume that the company has enough cash in its bank to pay off its short-term liabilities.
Colgate Case Study
Let us calculate Cash Ratios in Colgate.
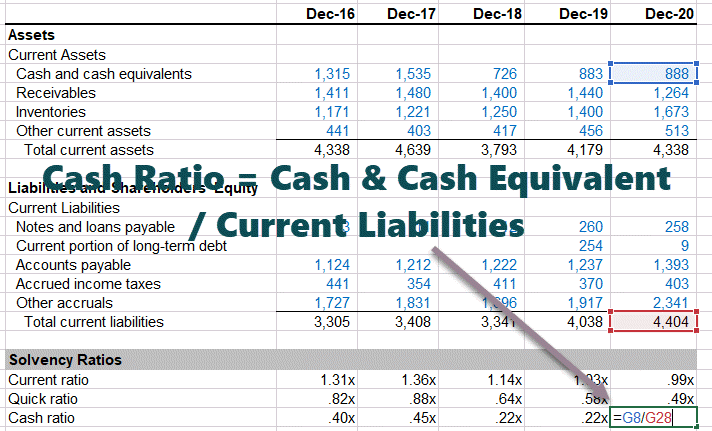
Colgate’s cash ratio has decreased from 0.45x in 2017 to 0.20x in 2020.
#8 – Turnover Ratios
We saw from the above three liquidity ratios (Current, Quick, and Cash Ratios) that it answers the question, “Whether the company has enough liquid assets to square off its current liabilities.” So this ratio is all about the $ amounts.
However, when we look at Turnover ratio analysis, we try to analyze the liquidity from “how long it will take for the firm to convert inventory and receivables into cash or time is taken to pay its suppliers.”
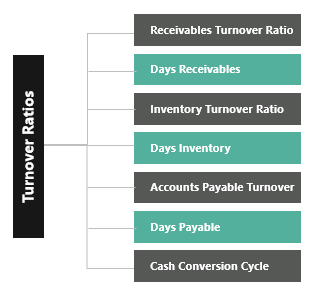
The commonly used turnover ratios include:
- Receivables turnover
- Accounts receivables days
- Inventory turnover
- Inventory days
- Payables turnover
- Payable days
- Cash Conversion Cycle
#9 – Receivables Turnover Ratio Analysis
What is Receivables Turnover Ratio analysis?
Accounts Receivables Turnover Ratio can be calculated by dividing Credit Sales by Accounts Receivables. Intuitively. It provides us the number of times Accounts Receivables (Credit Sales) is converted into Cash Sales
Formula
Receivables Turnover Formula = Credit Sales / Accounts Receivables
Accounts Receivables can be calculated for the full year or for a specific quarter. For calculating accounts receivables for a quarter, one should take annualized sales in the numerator.
Example
Let us take a simple Receivables Turnover Calculation example,
- Sales = $1000
- Credit given is 80%
- Accounts Receivables = $200
- Credit Sales = 80% of $1000 = $800
Accounts Receivables Turnover = $800 / $200 = 4.0x
Analyst Interpretation
- Please note that Total Sales include Cash Sales + Credit Sales. Only Credit Sales convert to Accounts Receivables; hence, we should only take Credit Sales.
- If a company sells most of its items on a Cash Basis, then there will be No Credit Sales.
- Credit Sales figures may not be directly available in the annual report. You may have to dig into the Management discussion and analysis to understand this number.
- If it is still hard to find the percentage of credit sales, then do have a look at conference calls where analysts question the management on relevant business variables. Sometimes it is not available at all.
Colgate Case Study
- To calculate the receivables turnover, we have considered the average receivables. We consider the “average” figures as these are balance sheet items.
- For, e.g., as shown in the image below, we took the average receivables of 2019 and 2020.
- Also, please note that I have taken the assumption that 100% of Colgate’s Sales were “Credit Sales.”
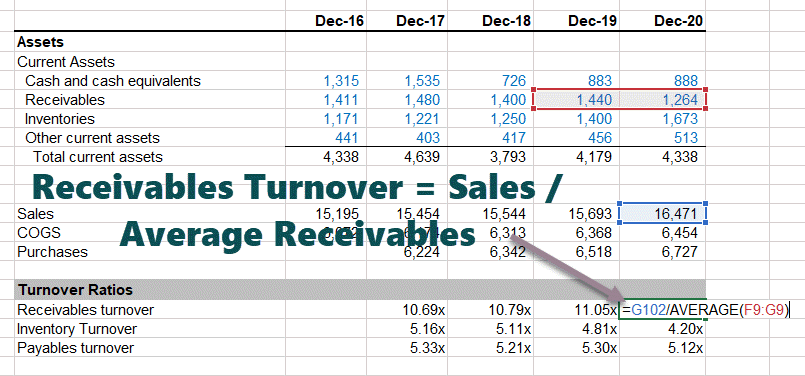
- We note that the Receivables Turnover was above 10x in 2016-2020. In 2020, it was at 12.18x
- Higher Receivables Turnover implies a higher frequency of converting receivables into cash (this is good!)
#10 – Days Receivables
What are Days Receivables?
Days receivables are directly linked with the Accounts Receivables Turnover. Days receivables express the same information but in terms of the number of days in a year. This provides an intuitive measure of Receivables Collection Days.
Formula
Accounts Receivables Days Formula = Number of Days in Year / Accounts Receivables Turnover
You may calculate Account Receivable days based on the year-end balance sheet numbers.
Many analysts, however, prefer to use the average balance sheet receivables number to calculate the average collection period. (a right way is to use the average balance sheet)
Let us take the previous example and find out the Days Receivables.
Example
Let us take a simple Days Receivables Calculation example,
- Accounts Receivables Turnover = 4.0x
- Number of days in a year = 365
Days Receivables = 365 / 4.0x = 91.25 days ~ 91 days
This implies that it takes 91 days for the company to convert Receivables into Cash.
Analyst Interpretation
- The number of days taken by most analysts is 365; however, some analysts also use 360 as the number of days in the year. This is normally done to simplify the calculations.
- Accounts receivable days should be compared with the average credit period offered by the company. For example, in the above case, if the Credit Period offered by the company is 120 days and they are receiving cash in just 91 days, this implies that the company is doing well to collect its receivables.
- However, if the credit period offered is said 60 days, then you may find a significant amount of previous accounts receivables on the balance sheet, which obviously is not good from the company’s point of view.
Colgate Case Study
- Let’s calculate Days Receivables for Colgate. To calculate Days Receivables, we have taken 365 days’ assumption.
- Since we had already calculated the receivables turnover above, we can easily calculate the day’s receivables now.
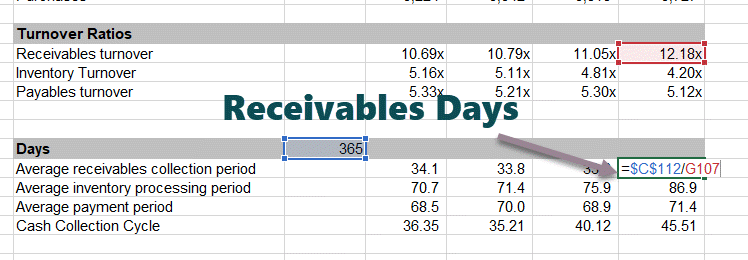
Days receivables or Average Receivables collection days have decreased from around 34.1 days in 2017 to 30 days in 2020.
- This means that Colgate is doing a better job of collecting its receivables. They may have started implementing a stricter credit policy.
#11 – Inventory Turnover Ratio Analysis
What is Inventory Turnover Ratio analysis?
The Inventory Ratio means how many times the inventories are restored during the year. It can be calculated by taking the Cost of Goods Sold and dividing it by Inventory.
Formula
Inventory Turnover Formula = Cost of Goods Sold / Inventory.
Let us take a simple Inventory Turnover Ratio Calculation example.
- Cost of Goods Sold = $500
- Inventory = $100
Inventory Turnover Ratio = $500 / $100 = 5.0x
This implies that during the year, inventory is used up 5 times and is restored to its original levels.
Analyst Interpretation
You may note that when we calculate receivables turnover, we took Sales (Credit Sales); however, in inventory turnover ratio, we took Cost of Goods Sold. Why?
The reason is that when we think about receivables, it directly comes from Sales made on a credit basis. However, the Cost of Goods sold is directly related to inventory and is carried on the balance sheet at cost.
To get an intuitive understanding of this, you may see the BASE equation.
B + A = S + E
- B = Beginning Inventory
- A = Addition to Inventory (purchases during the year)
- S = Cost of Goods sold
- E = Ending Inventory
S = B + A – E
As we note from the above equation, Inventory is directly related to the Cost of Goods Sold.
Colgate Case Study
- Let us calculate the Inventory Turnover Ratio of Colgate. Like in receivables turnover, we take the average inventory for calculating Inventory Turnover.
- Colgate’s inventory consists of Raw material and supplies, work in progress, and finished goods.
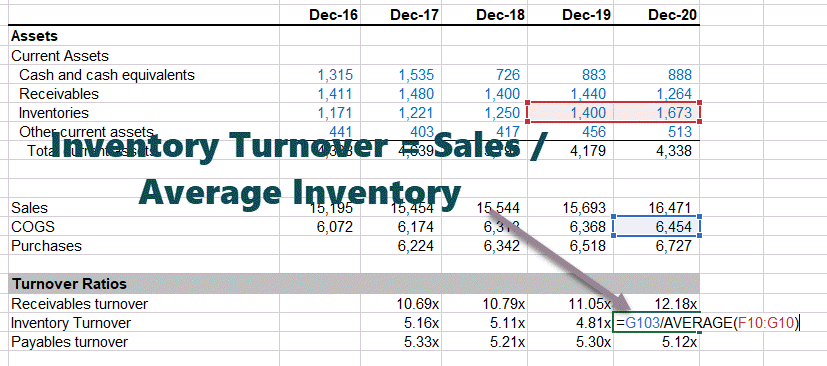
- Colgate’s inventory turnover has been decreasing over the last 4 years (In 2020, it was at 4.20x)
- A lower inventory turnover ratio means that Colgate is taking longer to process its inventory to finished goods.
#12 – Days Inventory
What is the Days Inventory?
Think of Inventory Days as the approximate number of days it takes for inventory to convert into a finished product.
Formula
Inventory Days Formula = Number of days in a year / Inventory Turnover.
Example
Let us take a simple Days Inventory Calculation example. We will use the previous example of the Inventory Turnover Ratio and calculate Inventory Days.
- Cost of Goods Sold = $500
- Inventory = $100
- Inventory Turnover Ratio = $500 / $100 = 5.0x
Inventory Days = 365/5 = 73 days.
This implies that Inventory is used up every 73 days on average and is restored to its original levels.
Analyst Interpretation
- You may also think of inventory days as the number of days a company can continue with production without replenishing its inventory.
- One should also look at the seasonality pattern in how inventory is consumed, depending on the demand. It is rare that inventory is consumed constantly throughout the year.
Colgate Case Study
Let us calculate the Inventory turnover days for Colgate. Inventory Days for Colgate = 365 / Inventory Turnover.
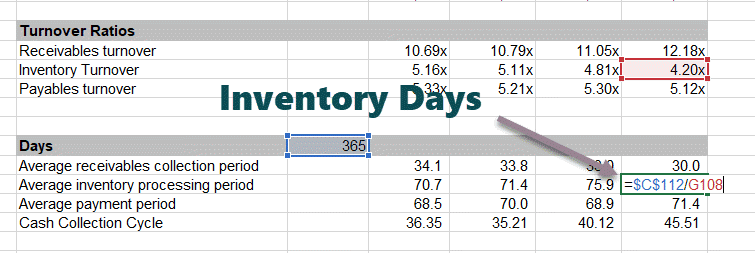
- We see that the inventory processing period has increased from 70.7 days in 2017 to around 86.9 days in 2020.
- This implies that Colgate is processing its inventory slowly as compared to 2017.
#13 – Accounts Payable Turnover
What is Accounts Payable Turnover?
Payables turnover indicates the number of times that payables are rotated during the period. It is best measured against purchases since purchases generate accounts payable.
Formula
Payables Turnover Formula = Purchases / Accounts Payables
Example
Let us take a simple Accounts Payable Turnover calculation example. From the Balance Sheet, you are provided with the following –
- Ending Inventory = $500
- Beginning Inventory = $200
- Cost of Goods Sold = $500
- Accounts Payable = $200
In this example, we need to first find out Purchases during the year. If you remember the BASE equation that we used earlier, we can easily find purchases.
B + A = S + E
- B = Beginning Inventory
- A = Additions or Purchases during the year
- S = COGS
- E = Ending Inventory
we get, A = S + E – B
Purchases or A = $500 + $500 – $200 = $800
Payables Turnover = $800 / $200 = 4.0x
Analyst Interpretation
- Some analysts make the mistake of taking the Cost of Goods Sold in the numerator of this accounts payable turnover formula.
- It is important to note here that Purchase is the one that leads to Payables.
- We earlier saw Sales can be Cash Sales and Credit sales. Likewise, Purchases can be Cash Purchases as well as Credit Purchases. Cash Purchases do not result in payables; it is only the Credit Purchases that lead to Accounts payables.
- Ideally, we should seek Credit Purchase information from the annual report.
Colgate Case Study
Here, we first calculate the Purchases.
Purchases 2020 = COGS 2020 + Inventory 2020 – Inventory 2019
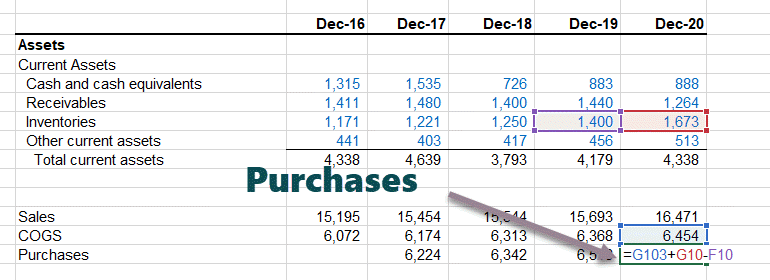
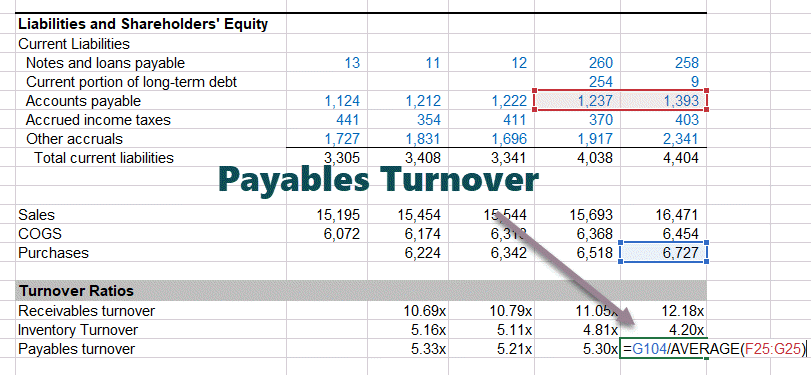
We note that the Payable turnover decreased to 5.12x in 2020. This implies that Colgate is taking a bit longer to make payments to its suppliers.
Once we have the purchases, we can now find the payables turnover. Please note that we use the average accounts payable to calculate the ratio.
#14 – Days Payable Ratio Analysis
What is Days Payable Ratio analysis?
Payable days represent the average number of days a company takes to make the payment to its suppliers.
Formula
Payables Days Formula = Number of Days in a year / Payables Turnover
Example
Let’s take a simple Payable Days calculation example. We will use the previous example of Accounts Payable Turnover to find the Payable days.
- We earlier calculated Accounts Payable Turnover as 4.0x
- Payable Days = 365 / 4 = 91.25 ~ 91 days
This implies that the company pays its clients every 91 days.
Analyst Interpretation
- The higher the accounts payable days, the better it is for the company from a liquidity point of view.
- Payable days can be affected by seasonality in the business. Sometimes a business may stock inventories due to the upcoming business cycle. This may distort the interpretations that we make on payable days if we are not aware of seasonality.
Colgate Case Study
Let us calculate Accounts Payable for Colgate. Since we have already calculated the Payables Turnover, we can calculate Payable days = 365/Payables Turnover.
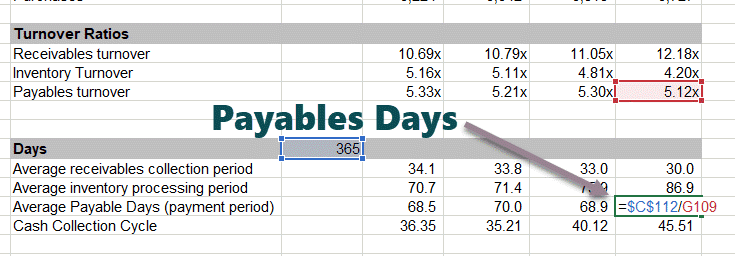
Payable days have increased to 71.4 days in 2020 as compared to 68.5 days in 2017.
#15 – Cash Conversion Cycle
What is the Cash Conversion Cycle?
The cash conversion cycle is the total time taken by the firm to convert its cash outflows into cash inflows (returns). Think of Cash Conversion Cycle is a time taken by a company to purchase the raw materials, then convert inventory into the finished product and sell the product and receive cash and then make the necessary payout for the purchases.
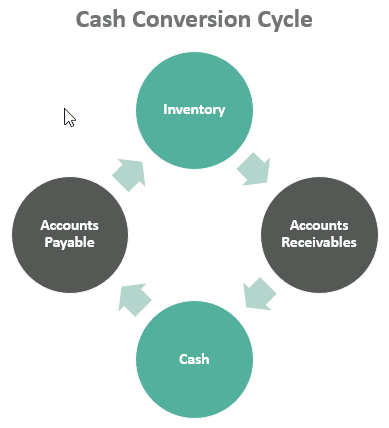
The Cash Conversion cycle depends primarily on three variables – Receivable Days, Inventory Days, and Payable Days.
Formula
Cash Conversion Cycle Formula = Receivable Days + Inventory Days – Payable Days
Example
Let us take a simple Cash Conversion Cycle calculation example,
- Receivable Days = 100 days
- Inventory Days = 60 days
- Payable Days = 30 days
Cash conversion cycle = 100 + 60 – 30 = 130 days.
Analyst Interpretation
- It signifies the number of days the firm’s cash is stuck in the operations of the business.
- A higher cash conversion cycle means that it takes a longer time for the firm to generate cash returns.
- However, a lower cash conversion cycle may be viewed as a healthy company.
- Also, one should compare the cash conversion cycle with the industry averages so that we are in a better position to comment on the higher/lower side of the cash conversion cycle.
Colgate Case Study
Cash Conversion Cycle of Colgate = Receivable Days + Inventory Days – Payable Days
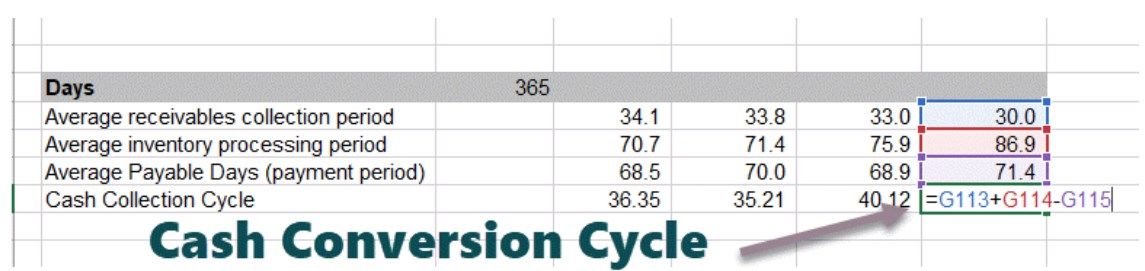
- Overall, we note that the cash collection cycle has increased from around 36.35 days in 2017 to 45.51 days in 2020.
- This implies that overall, the Colgate cash conversion cycle is deteriorating each year.
- We note that the receivables collection period has decreased overall, which has contributed to the decrease in the cash conversion cycle.
- Additionally, we also note that the average payable days have increased, which again positively contributed to the cash conversion cycle.
- However, the increase in inventory processing days in recent years has negatively affected its cash conversion cycle.
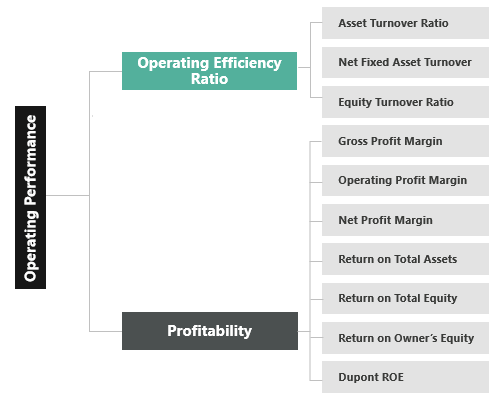
Ratio Analysis – Operating Performance
Operating performance ratios try and measure how the business is performing at the ground level and is sufficiency, generating returns relative to the assets deployed.
Operating Performance Ratios are two sub-divided as per the diagram below
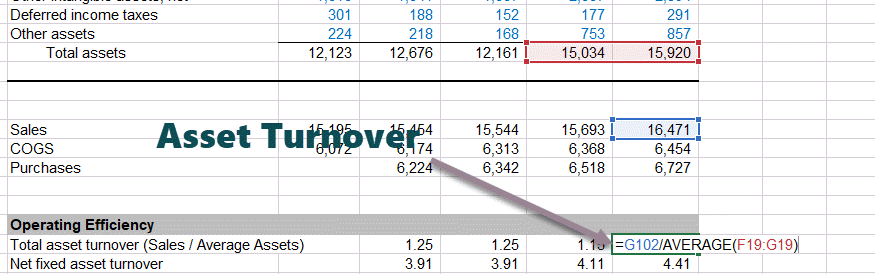
#16 – Asset Turnover Ratio Analysis
What is Asset Turnover Ratio analysis?
The asset turnover ratio is a comparison of sales to total assets. This ratio provides an indication of how efficiently the assets are being utilized to generate sales.
Formula
Asset Turnover ratio Formula = Total Sales / Assets
Example
Let us take a simple Cash Conversion Cycle calculation example.
- Sales of Company A = $900 million
- Total Assets = $1.8 billion
Asset Turnover = $900/$1800 = 0.5x
This implies that for every $1 of assets, the company is generating $0.5
Analyst Interpretation
- Asset turnovers can be extremely low or very high, depending on the Industry they operate in.
- The asset turnover of the Manufacturing firm will be on the lower side due to a large asset base as compared to a company that operates in the services sector (lower assets).
- If the firm has seen considerable growth in assets during the year or the growth has been seasonal, then the analyst should find additional information to interpret such numbers.
Colgate Case Study
Asset Turnover of Colgate = Sales / Average Assets
We note that the Asset Turnover for Colgate is showing a declining trend. Asset turnover was at 1.06x in 2020;
#17 – Net Fixed Asset Turnover
What is Net Fixed Asset Turnover?
Net Fixed Asset turnover reflects the utilization of fixed assets (Property Plant and Equipment).
Formula
Net Fixed Asset Turnover Formula = Total Sales / Net Fixed Assets
Example
Let us take a simple Net Fixed Asset Turnover calculation example.
- Total Sales = $600
- Net Fixed Assets = $600
Net Fixed Asset Turnover = $600 / $600 = 1.0x
This implies that for every $ spent on the fixed assets, the company is able to generate $1.0 in revenues.
Analyst Interpretation
- This ratio should be applied to high capital intensive sectors like Automobile, Manufacturing, Metals, etc.
- You should not apply this ratio to asset-light companies like Services or Internet-based as the Net Fixed assets will be really low and not meaningful from an analysis point of view.
- This number can look temporarily bad if the firm has recently added greatly to its capacity in anticipation of future sales.
Colgate Case Study
Net Fixed Asset Turnover of Colgate = Sales / Average Net Fixed Assets (PPE, net)
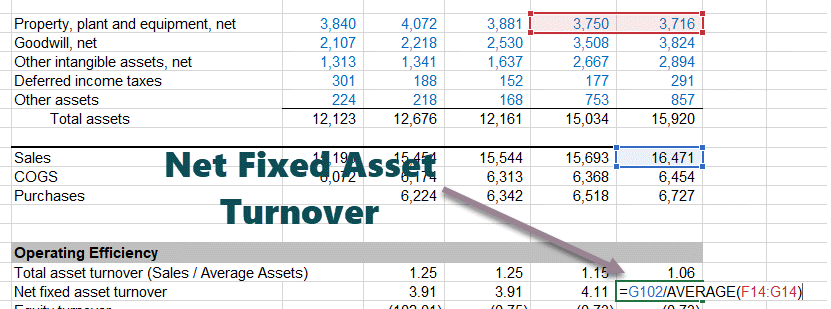
Unlike Asset Turnover, Net Fixed asset turnover is also showing an increasing trend. Net Fixed Asset turnover was at 3.91 in 2017; however, this ratio has increased to 4.41x in 2020.
#18 – Equity Turnover
What is Equity Turnover?
Equity turnover is the ratio of Total Revenue to the Shareholder’s Equity Capital. This ratio measures how efficient the company is deploying equity to generate sales.
Formula
Equity Turnover Ratio Formula = Total Sales / Shareholder’s Equity
Example
Let us take a simple Equity Turnover calculation example,
- Total Sales = $600
- Shareholder’s Equity = $300
Equity Turnover Ratio = $600 / $300 = 2.0x.
This implies that the company is generating $2.0 of sales for every $1.0 of shareholder’s equity.
Colgate Case Study
Colgate Equity Turnover = Sales / average Shareholder’s Equity
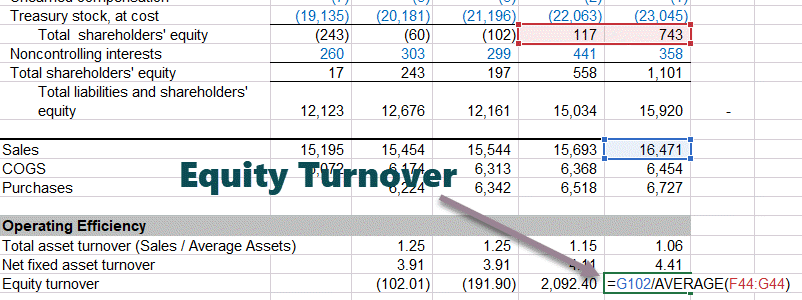
We note that historically, Colgate’s Equity Turnover is negative or very high. We cannot conclude much from here. This was primarily due to two reasons – a) Share buyback program of Colgate resulting in lowering of the Equity base each year. b) Accumulated losses net of taxes (these are those losses that don’t flow into the income statement).
Operating Profitability Ratio Analysis
Operating Profitability Ratios measure how much the costs are relative to the sales and how much profit is generated in the overall business. We try to answer questions like “how much the profit percentage” or “Is the firm controlling its expenses by buying inventory etc. at a reasonable price?”
#19 – Gross Profit Margin
What is the Gross Profit Margin?
Gross Profit is the difference between sales and the direct cost of making a product or providing service. Please note that costs like overheads, taxes, interests are not deducted here.
Formula
Gross Margin Formula = (Sales – Costs of Goods Sold)/Sales = Gross Profit / Sales
Example
Let us take a simple Gross Margin calculation example,
Assume from the Sales of a firm is $1,000 and its COGS is $600
- Gross Profit = $1000 – $600 = $400
- Gross Profit Margin = $400/$1000 = 40%
Analyst Interpretation
- Gross Margin can vary drastically between industries. For example, digital products sold online will have an extremely high Gross Margin as compared to a company that sells laptops.
- Gross margin is extremely useful when we look at the historical trends in the margins. If the Gross Margins has increased historically, then it could be either because of the price increase or control of direct costs. However, if the Gross margins show a declining trend, then it may be because of increased competitiveness and therefore resulting in the decreased sales price.
- In some companies, Depreciation expenses are also included in Direct Costs. This is incorrect and should be shown below the Gross Profit in the Income Statement.
Colgate Case Study
Let us calculate Colgate’s Gross Margin. Colgate’s Gross Margin = Gross Profit / Net Sales.
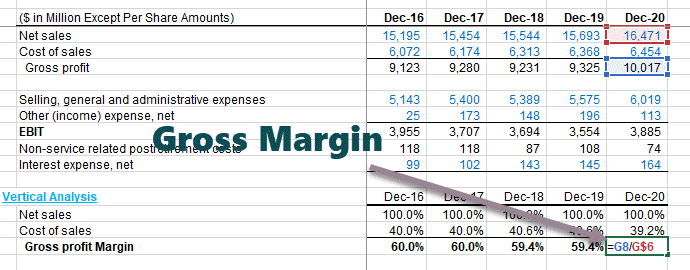
Please note that depreciation related to manufacturing operations are included herein Cost of Sales (Colgate 10K 2020, pg 79) Shipping and handling costs may be reported either in the Cost of Sales or Selling General and Admin Expenses. Colgate has, however, reported these costs as a part of Selling General and Admin Expenses. If such expenses are included in the Cost of Sales, then the Gross margin of Colgate would have decreased by 845 bps and decreased by 810 bps in both 2019 and 2018, respectively.
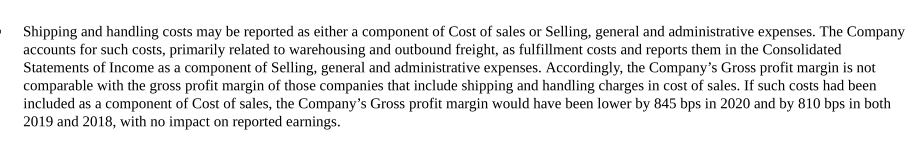
source: – Colgate 10K 2020, pg 54
#20 – Operating Profit Margin
What is the Operating Profit Margin?
Operating profit or Earnings Before Interest and Taxes (EBIT) margin measures the rate of profit on sales after operating expenses. Operating income can be thought of as the “bottom line” from operations.
Formula
Operating Profit Margin = EBIT / Sales
Example
Let us take a simple Operating Profit Margin calculation example,
We will use the previous example.
- Assume from the Sales of a firm is $1,000 and its COGS is $600
- SG&A expense = $100
- Depreciation and Amortization = $50
- EBIT = Gross Profit – SG&A – D&A = $400 – $100 – $50 = $250
EBIT Margin = $250/$1000 = 25%
Analyst Interpretation
- Please note that some analyst takes EBITDA (Earning before interest taxes depreciation and amortization) instead of EBIT as Operating Profit. If this is so, they assume that depreciation and amortization are non-operating expenses.
- The most analyst prefers taking EBIT as Operating Profit. Operating Profit Margin is most commonly tracked by analysts.
- You need to be mindful of the fact that many companies include non-recurring items (gains/losses) in SG&A or other expenses above EBIT. This may increase or decrease the EBIT Margins and skew your historical analysis.
Colgate Case Study
Colgate’s Operating Profit = EBIT / Net Sales.
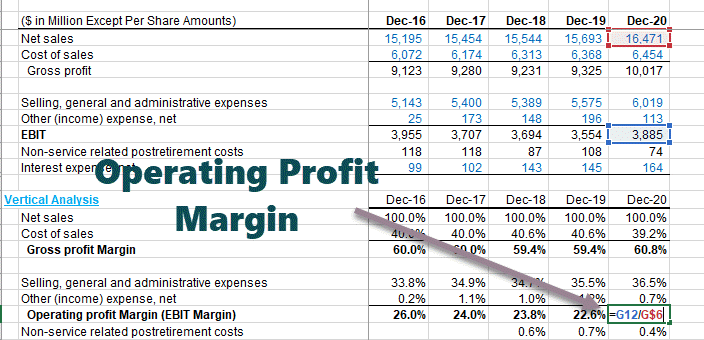
Historically, Colgate’s Operating Profit has remained in the range of 24-26.0%
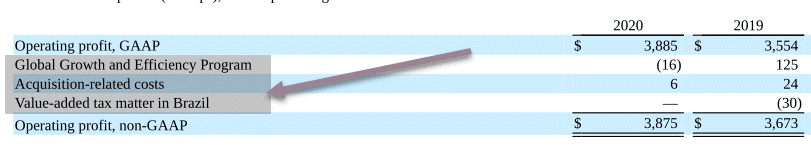
However, in 2019, Colgate’s EBIT Margin decreased significantly to 22.6%. In 2019, Operating profit included charges resulting from the restructuring expenses (Global Growth and Efficiency Program), acquisition-related costs and a benefit related to a value-added tax matter in Brazil
#21 – Net Margin
What is Net Margin?
Net Margin is basically the net effect of operating as well as financing decisions taken by the company. It is called a Net Margin because, in the numerator, we have Net Income (Net of all the operating expenses, interest expenses as well as taxes)
Formula
Net Margin Formula = Net Income / Sales
Example
Let us take a simple Net Margin calculation example; continuing with our previous example, EBIT = $250, Sales = $1000.
- We now assume that interest is $100, and taxes is charged at the rate of 30% of EBIT = $250
- Interest = $100
- EBT = $150
- Taxes = $45
- Net Profit = $105
Net Profit Margin = $105/$1000 = 10.5%
Analyst Interpretation
- Like Gross margins, Net Margins can also vary drastically across industries. For example, Retail is a very low margin business (~5%), whereas a website selling digital products may have a Net Profit Margin in excess of 40%.
- Net Margins is useful for comparison between companies within the same industry due to similar products and cost structure.
- Net Profit Margins can vary historically due to the presence of non-recurring items or non-operating items.
Colgate Case Study
Let us have a look at the Net Margin of Colgate.
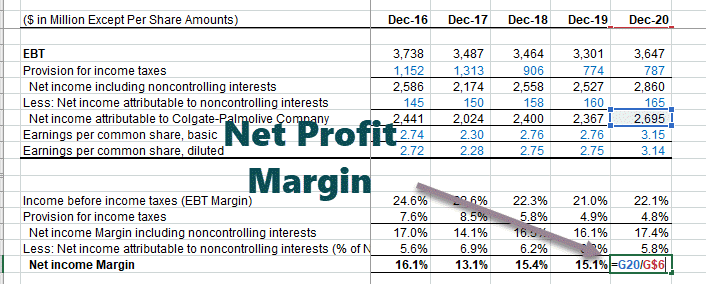
- Historically, Net Margin for Colgate has been in the range of 13.1% – 16.4%.
- However, Net Margin increased in 2020 to 16.4% primarily due to after-tax benefits of $13 million resulting from the restructuring program (Global Growth and Efficiency Program) and $71 million tax benefit related to
subsidiary and operating structure initiatives.
#22 – Return on Total Assets
What is Return on Total Assets?
Return on Assets or Return on Total Assets relates to the firm’s earnings to all capital invested in the business.
Formula
Return on Total Asset Formula = EBIT / Total Assets.
Two important things to note there –
- Please note that in the denominator, we have Total Assets, which basically takes care of both the Debt and Equity Holders.
- Likewise, in the numerator, the Earnings should reflect something that is before the payment of interest.
Example
Let us take a simple Return on Total example,
- Company A has an EBIT of $500 and Total Assets = $2000
- Return on Total Assets = $500/$2000 = 25%
This implies that the company is generating a Return on Total Assets of 25%.
Analyst Interpretation
- Many analysts use the numerator as Net Income + Interest Expenses instead of EBIT. They basically are deducting the taxes.
- Return on Assets can be low or high, depending on the type of industry. If the company operates in a capital-intensive sector (Asset heavy), then the return on assets may be on the lower side. However, if the company is Asset Light (services or internet company), they tend to have had a higher Return on Assets.
Colgate Case Study
Let us now calculate the Return on the total Assets of Colgate. Colgate’s Return On Total Assets = EBIT / Average total assets
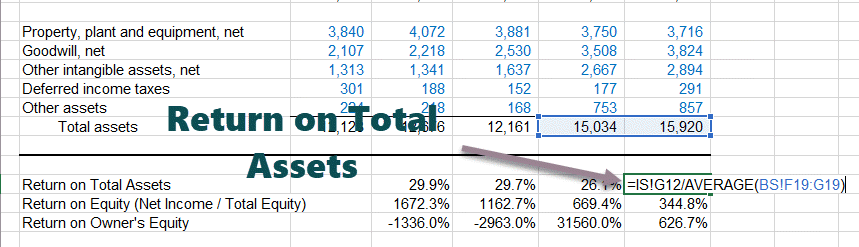
Colgate’s Return on total assets has been declining since 2017. Most recently, it has declined to its lowest at 25.1%. Why?
Let’s investigate.
- Two reasons can contribute to decreasing – either the denominator, i.e., average assets have increased significantly, or the Numerator Net Sales have dropped significantly.
- In Colgate’s case, the total assets increased significantly to $15.03 billion in 2019 and $15.92 billion in 2020. We also note that the overall Net sales have increased by 5% in 2020. The net effect of the two has resulted in a decrease in the decline in Return on Total Assets.
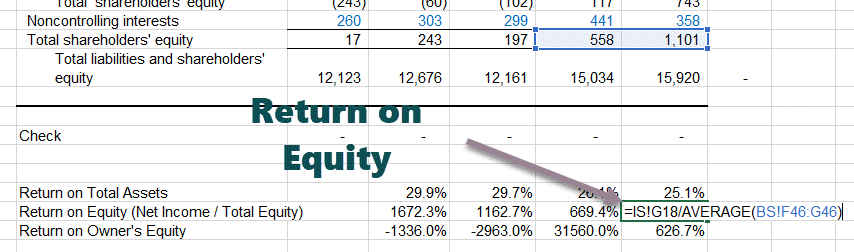
#23 – Return on Equity
What is Return on Equity?
Return on Equity means the rate of return earned on the Total Equity of the firm. It can be thought of as dollar profits a company generates on each dollar investment of Total Equity.
Formula
Return on Equity Formula = Net Income / Total Equity
Please note Total Equity = Ordinary Capital + Reserves + Preference + Minority Interests
Example
Let us take a simple Return on Equity example.
- Net Income = $50
- Total Equity = $500
Return Equity = $50/$500 = 10%
Analyst Interpretation
- Please note that the Net income will be before the preference dividends and minority interest are paid.
- Higher Return on Equity implies a higher return to the Stakeholders.
Colgate Case Study
- Colgate’s Return on Equity = Net Income (before pref dividends & minority interest) / average total equity.
- Please do remember to take the Net income before minority interest payments in Colgate. This is because we are using the total equity (including the non-controlling assets).
- We note the Return on Equity in 2020 was at 344.8%. This result is somehow not making much sense here and cannot be interpreted.
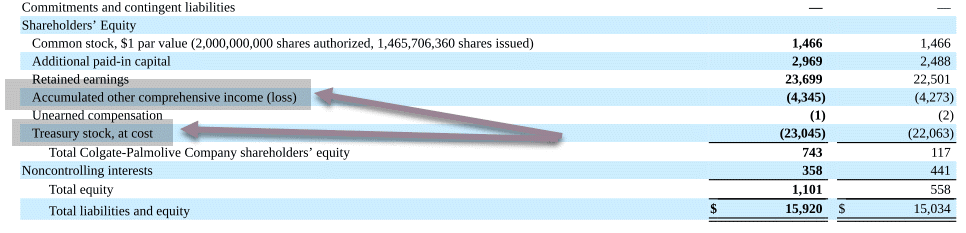
- Return on Equity jumped primarily due to a decrease in the denominator – Shareholder’s equity (increase in treasury stock because of buyback and also because of accumulated losses that flow through the Shareholder’s Equity).
#24 – Return on Owner’s Equity
What is Return on Owners Equity?
Return on equity or Return on Owner’s Equity is based only on the common shareholder’s equity. Preferred dividends and minority interests are deducted from Net Income as they are a priority claim. Return on equity provides us with the Rate of return earned on the Common Shareholder’s Equity.
Formula
Return on Owners Equity = Net Income (after pref dividends and minority interest) / Common Shareholder’s Equity
Example
Let us take a simple ROE calculation example,
- Net Income = $50
- Total Equity = $500
- Owners Equity = $400
ROE (owners) = $50 / $400 = 12.5%
Analyst Interpretation
- Since common shareholder’s equity is a year-end number, some analyst prefer taking the average shareholder’s equity (average of beginning and year-end)
- ROE can be basically considered as a profitability ratio from a shareholder’s point of view. This provides how much returns on generated from shareholder’s investments, not from the overall company investments in assets. (Please note Total Investments = Shareholder’s Equity + Liability that includes Current Liabilities and Long term Liabilities)
- ROE should be analyzed over a period of time (5 to 10 year period) in order to get a better picture of the growth of the company. Higher ROE does not get passed directly to the shareholders. Higher ROE -> Higher Stock Prices.
Colgate Case Study

Like the Return on Total Equity, Return on Owners Equity has jumped significantly to 626.7% in 2020.
Return on Equity increased because of the very low Shareholder’s Equity base in 2019-2020. (reasons as discussed earlier in Return on Total Equity).
#25 – Dupont ROE
What is Dupont ROE?
Dupont ROE is nothing but an extended way of writing an ROE formula. It divides ROE into several ratios that collectively equal ROE while individually providing insight to the most important term in ratio analysis of a financial statement.
Formula
Dupont ROE formula = (Net Income / Sales) x (Sales / Total Assets) x (Total Assets / Shareholder’s Equity)
The above formula is nothing but the ROE formula = Net Income / Shareholder’s Equity.
Example
Let us take a simple Dupont ROE calculation example.
- Net Income = $50
- Sales = $500
- Total Assets = $200
- Shareholder’s Equity = $400
- Gross Margin = Net Income / Sales = $50 / $500 = 10%
- Asset Turnover = Sales / Total Assets = $500/$200 = 2.5x
- Asset Leverage = Total Asset / Shareholder’s Equity = $200 / $400 = 0.5
Dupont ROE = 10% x 2.5 x 0.5 = 12.5%
Analyst Interpretation
- THE Dupont ROE formula provides additional ways to analyze the ROE ratio and helps us find out a reason for the final number.
- The first term (Net Income/Sales) is nothing but the Net Profit Margin. We know that the Retail sector operates on a low-profit margin; however, software product-based companies may operating on a high-profit margin.
- The second term here is (Sales/Total Assets); we normally call this term Asset turnovers. It provides us with a measure of how efficiently the assets are being utilized.
- The third term here is (Total Assets / Shareholder’s Equity); we call this ratio Asset Leverage. Asset leverage gives insight into how the company may be able to finance the purchase of new assets. Higher Asset leverage does not mean that it is better than the low multiplier. We need to look at the financial health of the company by performing a full ratio analysis of the financial statement.
Colgate Case Study
Colgate Dupont ROE = (Net Income / Sales) x (Sales / Total Assets) x (Total Assets / Shareholder’s Equity)
Please note that the Net Income is after the minority shareholder’s payment.
Also, the shareholder’s equity consists of only the common shareholders of Colgate.
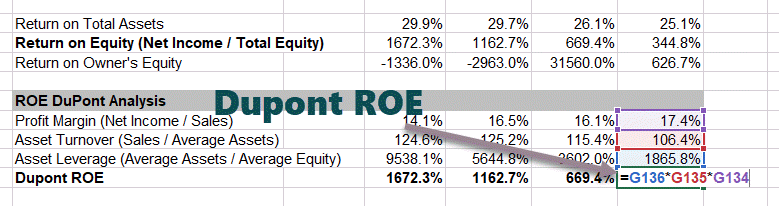
We note that the asset turnover has shown a declining trend over the past 7-8 years.
Profitability, however, has increased over the past 4 years.
Asset leverage (average total assets / average total equity) is also decreasing over the years. You may note that the Asset Leverage has shown a steady decline over the past 4 years and is currently standing at 18.65x.
The net result due to the three above factors resulted in a decrease in ROE.
Risk Analysis
Risk analysis examines the uncertainty of income for the firm and for an investor.
Total firm risks can be decomposed into three basic sources – 1) Business risk, 2) Financial Risk 3) External Liquidity Risk.
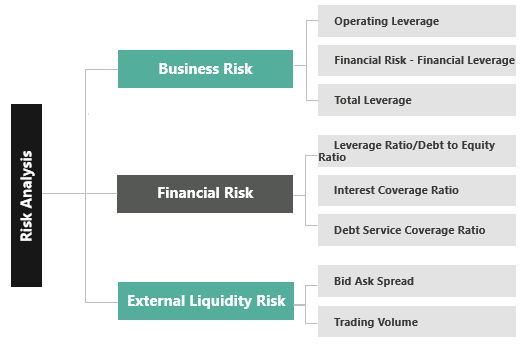
Business Risk
Wikipedia defines it as “the possibility a company will have lower than anticipated profits or experience a loss rather than making a profit.” If you look at the income statement, there are many line items that contribute to the risk of making losses. In this context, we discuss three kinds of business risks – Total Leverage, Operating Leverage, and Financial Leverage.
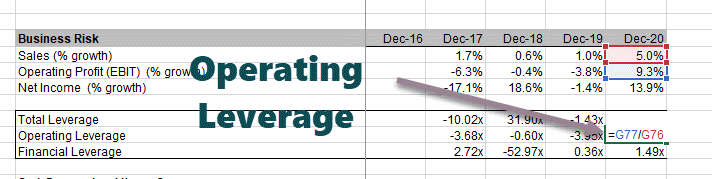
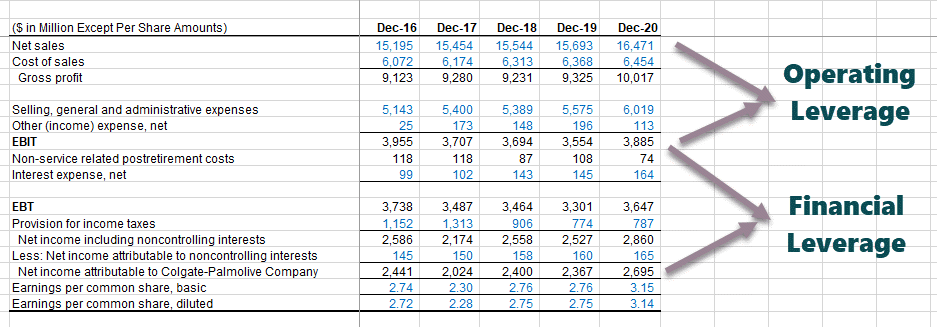
#26 – Operating Leverage
What is Operating Leverage?
Operating leverage is the percentage change in operating profit relative to sales. Operating leverage is a measure of how sensitive the operating income is to the change in revenues.
Formula
Operating Leverage Formula = % change in EBIT / % change in Sales.
Please note that the greater use of fixed costs, the greater the impact of a change in sales on the operating income of a company.
Example
Let us take a simple Operating Leverage calculation example.
- Sales 2020 = $500, EBIT 2020 = $200
- Sales 2019 = $400, EBIT 2019 = $150
- % change in EBIT = ($200-$150)/$100 = 50%
- % change in Sales = ($500-$400)/$400 = 25%
Operating Leverage = 50/25 = 2.0x
This means that when Operating profit changes by 2% for every 1% change in Sales.
Analyst Interpretation
- The greater the fixed costs, the higher is the operating leverage.
- Between three to ten years of data should be used for calculating Operating Leverages.
Colgate Case Study
- Colgate’s Operating Leverage = % change in EBIT / % change in Sales
- I have calculated the operating leverages for each year from 2017 – 2020.
- Colgate’s operating leverage is very volatile as it ranges from -3.95x to 1.88x. This is primarily due to the inclusion of restructuring expenses in SG&A.
- It is expected that Colgate’s Operating leverage to be higher as we note that Colgate has made significant investments in intangible assets in 2019 and 2020.
#27 – Financial Leverage
What is Financial Leverage?
Financial leverage is the percentage change in Net profit relative to Operating Profit. Financial leverage measures how sensitive the Net Income is to the change in Operating Income.
Financial leverage primarily originates from the company’s financing decisions (usage of debt). Like in the operating leverage, fixed assets lead to higher operating leverage. In Financial leverage, the usage of debt primarily increases the financial risk as they need to pay off interest
Formula
Financial Leverage formula = % change in Net Income / % change in EBIT
Example
Let us take a simple Financial Leverage calculation example,
- Net Income 2020 = $120, EBIT 2020 = $200
- Net Income 2019 = $40, EBIT 2019 = $150
- % change in EBIT = ($200-$150)/$100 = 50%
- % change in Net Income = ($120-$40)/$40 = 200%
Financial Leverage = 200/50 = 4.0x
This means that Net Income changes by 4% for every 1% change in Operating Profit.
Analyst Interpretation
- The greater the Debt, the higher is the financial leverage.
- Between five to ten years of data should be used for calculating Financial Leverages.
Colgate Case Study
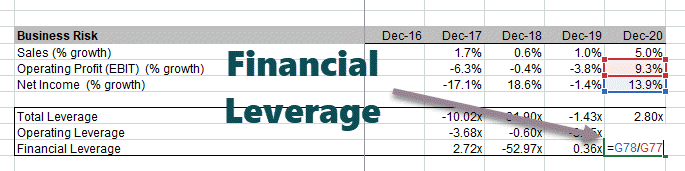
Colgate’s Financial Leverage has remained volatile (-52.97x in 2018 and 1.49x in 2020)
#28 – Total Leverage
What is Total Leverage?
Total leverage is the percentage change in Net profit relative to its Sales. Total leverage measures how sensitive the Net Income is to the change in Sales.
Formula
Total Leverage Formula = % change in Net Profit / % change in Sales
= Operating Leverage x Financial Leverage
Example
Let us take a simple Total Leverage calculation example,
- Sales 2020 = $500, EBIT 2020 = $200, Net Income 2020 = $120
- Sales 2019 = $400, EBIT 2019 = $150, Net Income 2019 = $40
- % change in Sales = ($500-$400)/$400 = 25%
- % change in EBIT = ($200-$150)/$100 = 50%
- % change in Net Income = ($120-$40)/$40 = 200%
Total Leverage = % change in Net Income / % change in Sales =200/25 = 8x.
Total Leverage = Operating Leverage x Financial Leverage = 2 x 4 = 8x (Operating and Financial Leverage calculated earlier)
This implies for every 1% change in Sales, the Net Profit moves by 8%.
Analyst Interpretation
Higher sensitivity could be because of higher operating leverage (higher fixed cost) and higher financial leverage (higher debt), 3-10 years of data should be taken to calculate the total leverage.
Colgate Case Study
Let us now look at the Total Leverage of Colgate.
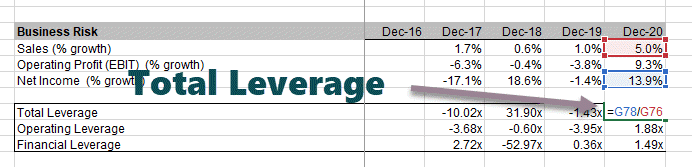
- Colgate’s Total Leverage is also volatile (as there is significant volatility in operating and financial leverage)
Financial Risk
Financial risk is the type of risk primarily associated with the risk of default on the company loan. We discuss 3 types of financial risk ratios – Leverage Ratio, Interest Coverage Ratio, and DSCR ratio.
#29 – Leverage Ratio or Debt to Equity Ratio
What is Leverage Ratio?
The leverage ratio calculates how much the company uses debt as compared to its equity. This is an important ratio for bankers as it provides the company’s ability to pay off debt using its own capital.
Formula
Leverage Ratio Formula = Total Debt (current + long term) / Shareholder’s Equity
Generally, the lower the ratio better it is. Debt includes current debt + long-term debt.
Example
Let us take a simple Leverage Ratio calculation example.
- Current Debt = $100
- Long Term Debt = $900
- Shareholder’s Equity = $500
Leverage Ratio = ($100 + $900) / $500 = 2.0x
Analyst Interpretation
- A lower ratio is generally considered better as it shows greater asset coverage of liabilities with its own capital.
- Capital-intensive sectors generally show a higher debt to equity ratio (leverage ratio) as compared to the services sector.
- If the leverage ratio is increasing over time, then it may be concluded that the firm is unable to generate sufficient cash flows from its core operations and is relying on external debt to stay afloat.
Colgate Case Study
Leverage Ratio of Colgate = (Current portion of long term debt + Long term Debt) / Shareholder’s Equity.
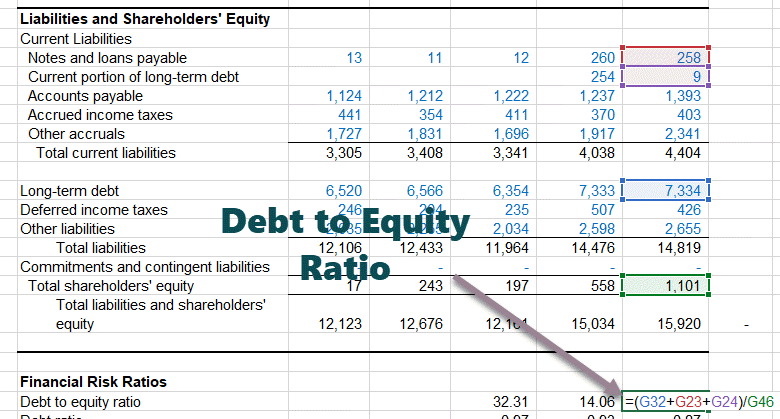
The Debt to Equity has decreased from 32.31x in 2018 to 6.90x in 2020. This is primarily due to an increase in shareholder’s equity over the last 3 years. We note that the Debt Ratio in 2020 was 0.87.
#30 – Interest Coverage Ratio
What Is the Interest Coverage Ratio?
The Interest Coverage ratio signifies the ability of the firm to pay interest on the assumed debt.
Formula
Interest Coverage Formula = EBITDA / Interest Expense
Please note that EBITDA = EBIT + Depreciation & Amortization
Example
Let us take a simple Interest Coverage Ratio calculation example,
- EBIT = $500
- Depreciation and Amortization = $100
- Interest Expense = $50
- EBITDA = $500 + $100 = $600
Interest Coverage Ratio = $600 / $50 = 12.0x
Analyst Interpretation
- Capital intensive firms have higher depreciation and amortization, resulting in lower operating profit (EBIT)
- In such cases, EBITDA is one of the most important measures as it is the amount available to pay off interest (depreciation and amortization is a non-cash expense).
- Higher interest coverage ratios imply a greater ability of the firm to payoff its interests.
- If Interest coverage is less than 1, then EBITDA is not sufficient to pay off interest, which implies finding other ways to arrange funds.
Colgate Case Study
Colgate’s Interest Coverage Ratio = EBITDA / Interest Expense.
Please note that depreciation and amortization expenses are not provided in the income statement. These were taken from the Cash Flow statements.
Also, the Interest expense shown in the Income Statement is the net number (Interest Expense – Interest Income)
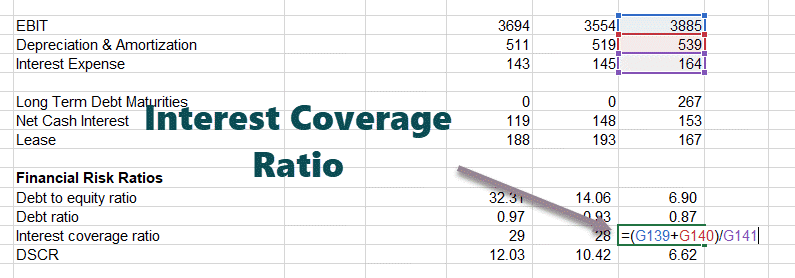
Colgate has a very healthy Interest coverage ratio. More than 25x in the past three years.
#31 – Debt Service Coverage Ratio (DSCR)
What is DSCR?
Debt Service Coverage Ratio tells us whether the Operating Income is sufficient to pay off all obligations that are related to debt in a year. It also includes committed lease payments. Debt servicing consists of not only the interest but also some principal portion also is repaid annually.
Formula
Debt Service Coverage Formula = Operating Income / Debt Service
Operating Income is nothing but EBIT
Debt Service is Principal Payments + Interest Payments + Lease Payments
Example
Let us take a simple DSCR calculation example,
- EBIT = $500
- Principal Payment = $125
- Interest Payment = $50
- Lease Payments = $25
- Debt Service = $125 + $50 + %25 = $200
DSCR = EBIT / Debt Service = $500/$200 = 2.5x
Analyst Interpretation
- A DSCR of less than 1.0 implies that the operating cash flows are not sufficient enough for Debt Servicing, implying negative cash flows.
- This is a pretty useful matrix from the Bank’s point of view, especially when they give loans against property to individuals.
Colgate Case Study
Colgate’s Debt Service Coverage Ratio = Operating Income / Debt Service
Debt Service = Principal Repayment of Debt + Interest Payment + Lease Obligations
For Colgate, we get the Debt service obligations from its 10K reports.
Please note that you get the estimate of the Debt Service in the 10K reports.
For finding out the historical Debt Service Payments, you need to refer to the 10Ks prior to 2020.
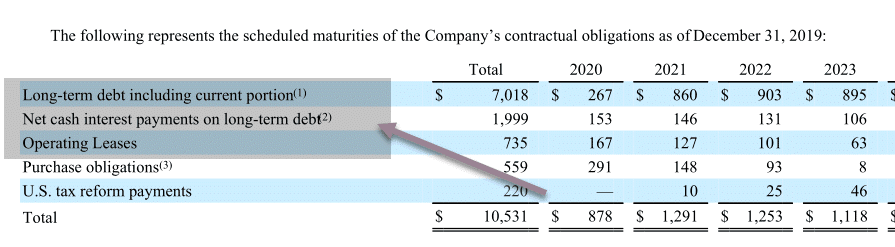
Colgate 10K 2020, pg 46.
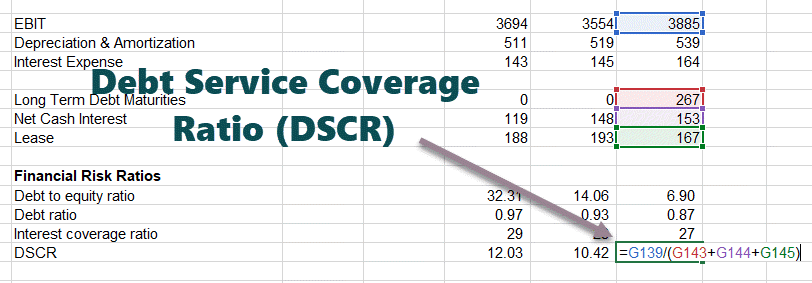
Debt Service Coverage Ratio or DSCR for Colgate is healthy at around 6.62x for 2020.
However, the DSCR has deteriorated a bit in the recent past.
You can click here for a detailed, in-depth article on DSCR Ratio
#32 – Bid-Ask Spread
What is Bid-Ask Spread?
Bid-Ask Spread is a very important parameter that helps us understand how the stock prices get affected by the purchase or sale of stocks. The bid is the highest price that the buyer is willing to pay. Ask is the lowest price at which the seller is willing to sell.
Example
Let us take a simple Bid-Ask Spread calculation example.
If the bid price is $75 and the asking price is $80, then the bid-ask spread is the difference between the ask price and the bid price.$80 – $75 = $5.
Analyst Interpretation
- External market liquidity is an important source of risk to investors.
- If the bid-ask spread is low, then the investors are able to buy or sell assets with little price changes.
- Also, another factor of external market liquidity is the dollar value of shares traded.
Colgate Case Study
Let us look at Colgate Bid-Ask Spread.
As we note from the below snapshot, Bid = 78.61 and Ask = $80.30
Bid Ask Spread = 80.30 – 78.61 = 1.69
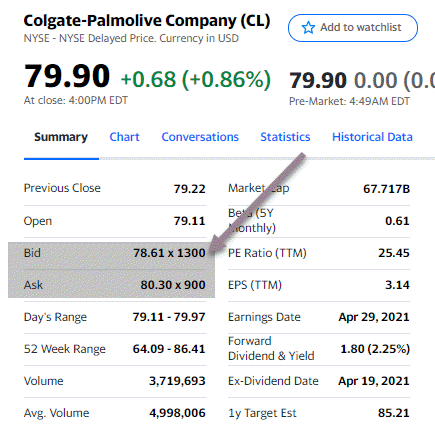
source: Yahoo Finance
#33 – Trading Volume
What is Trading Volume?
Trading volume refers to the average number of shares traded in a day or over a period of time. When the average trading volume is high, this implies that the stock has high liquidity (can be easily traded). Numerous buyers and sellers provide liquidity.
Example
Let us take a simple Trading Volume example.
There are two companies – Company A and B. The average daily traded volume of Company A is 1000, and that of Company B is 1 million.
Which company is more liquid? Obviously, company B, as there is more investor’s interest, and traded more.
Analyst Interpretation
- If the trading volume is high, then investors will show more interest in the stock that may help in an increase in the share price.
- If the trading volume is low, then fewer investors will have an interest in the stocks. Such stock will be less expensive due to the unwillingness of investors to buy such stocks.
Colgate Case Study
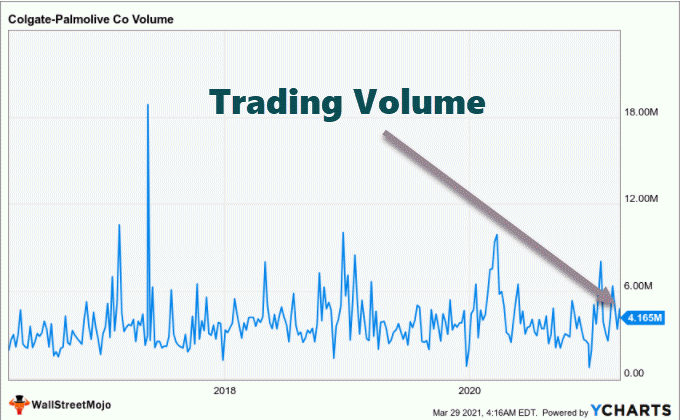
Let us look at the trading volume of Colgate. We note from the above graph that Colgate traded volume was at around 4.165 million shares. This is a fairly liquid stock.
Growth Analysis
The growth rate is one of the most important parameters when we look at analyzing a company. As a company becomes bigger and bigger, its growth tapers and reaches a long-term sustainable growth rate. In this, we discuss how sustainable growth rates are important.
#34 – Sustainable Growth
What is Sustainable Growth?
The company’s sustainable topline growth is one of the most important parameters for investors as well as creditors in ratio analysis. It helps the investor forecast the growth in earnings and valuations.
It is important to find the sustainable growth rate of the company. The sustainable growth rate is a function of two variables:
- What is the rate of return on equity (which gives the maximum possible growth)?
- How much of that growth is put to work through earnings retention (rather than being paid out in dividends)?
Formula
Sustainable Growth Rate Formula = ROE x Retention rate
Example
Let us take a simple Sustainable Growth calculation example.
- ROE = 20%
- Dividend Payout ratio = 30%
Sustainable Growth Rate = ROE x Retention Rate = 20% x (1-0.3) = 14%
Analyst Interpretation
- If the company is not growing, then there can be greater chances of default on the debt. Company’s growth phase is generally divided into three parts – Hypergrowth period, Maturity Phase, Decline Phase
- The Sustainable Growth rate formula is primarily applicable in the Mature Phase.
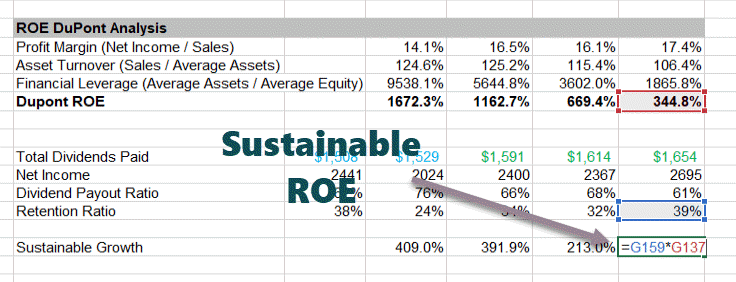
Colgate Case Study
Let us now look at the sustainable growth rate of Colgate. Sustainable. We note that the sustainable ROE as per the formula comes out to be around 133.2% in 2020. For all earlier years, it is in excess of 200% (which seems highly unlikely). Due to recent volatility in foreign exchange (leading to sales volatility) and buybacks done by the management (leading to an increase in ROE), sustainable growth is not making sense here.
Benefits
Individuals can understand ratio analysis benefits in detail by going through the following points:
- This type of analysis helps in assessing and interpreting the financial performance and efficiency of a company. It provides companies with key insights that help make informed decisions.
- Operational efficiency ratios help measure how efficiently a company utilizes its resources for generating income. Using them, a business can identify inaccuracies concerning operations and take measures to streamline processes and improve productivity.
- This process helps in the identification of business risks through the analysis of variability in income and operating leverage. It also helps in assessing the risks linked with a company’s debt levels and capital structure.
- Comparing such ratios of companies operating in the same industry enables benchmarking. This helps spot areas requiring improvement or competitive advantages, which, in turn, helps make enhanced strategic decisions to improve performance.
- The process helps formulate future strategies as it allows companies to estimate trends based on historic financial ratios. Moreover, analysis of ratios helps in preparing for price fluctuations in the market.
- Net profit margin, gross profit margin, and other profitability ratios offer valuable insights into how efficiently a business generates profit in comparison to its shareholders’ equity, assets, and sales.
- Certain ratios, like the quick ratio and current ratio, allow businesses to gauge their capacity to fulfill short-term financial obligations. Thus, these ratios help organizations ensure that they maintain sufficient liquidity to pay off their immediate liabilities.
Limitations
Some noteworthy disadvantages of ratio analysis are as follows:
- Inflationary Effects: Companies release financial statements at regular intervals, resulting in time differences between every release. If inflation materializes between such periods, the financial statements do not reflect the real prices. One cannot compare the numbers of the different periods without making adjustments for inflation.
- Historical Information: Since ratio analysis is conducted on the basis of historical data, it may not be an ideal tool for making predictions concerning future performance.
- Changes In Operations: When significant changes take place in a business’s operations, this type of analysis may result in misleading conclusions regarding future performance.
- Financial Statements’ Manipulation: If an organization’s management manipulates the financial statements, ratio analysis will likely fail to provide a reflection of the business’s true nature.
- Seasonal Effects: Since one cannot adjust this type of analysis on the basis of seasonal effects, the chance of false interpretations is very high.
Conclusion
Now that we have calculated all 32 ratios, you should appreciate that ratio analysis includes learning about the company from all dimensions. A single ratio does not provide us with a full understanding of the company. All the ratios need to be looked at cohesively and are interconnected. We noted that Colgate has been an amazing company with solid fundamentals.
Now that you have done the fundamental analysis of Colgate, you can move forward and Learn Financial Modeling in Excel (forecasting of Colgate’s Financial Statements). Don’t forget to look at these Financial modeling tips and also download financial modeling templates.

Frequently Asked Questions (FAQs)
What are the objectives of ratio analysis?
The objectives of carrying out this process are as follows:
- It helps make accounting data easier to understand.
- The analysis can provide a clear picture of an organization’s solvency and liquidity position.
- This process helps gauge profitability and make informed decisions concerning operational and financial activities.
What are the different applications of ratio analysis?
The following pointers provide a clear idea regarding some of the applications of this process.
- Investment Analysis: Businesses can use this analysis to know the possible returns of different investment opportunities
- Creditworthiness Evaluation: Carrying out this process allows one to assess a company’s repayment capacity.
- Decision-Making: It allows a company’s internal management to make informed decisions.
- Mergers And Acquisitions: This form of analysis helps determine whether potential mergers, partnerships, or acquisitions are viable.
From where can one get financial data to carry out ratio analysis?
Individuals can find the financial data for this type of analysis in a company’s financial statements, like the income statement and balance sheet. One can find these statements in the organization’s annual reports. Alternatively, the information is publicly available in financial databases and filings with regulators.
What Is Ratio Analysis in Finance?
Ratio analysis is the quantitative interpretation of the company’s financial performance. It provides valuable information about the organization’s profitability, solvency, operational efficiency and liquidity positions as represented by the financial statements.
This expert-written guide goes beyond the usual gibberish and explores practical Financial Statement Analysis as used by Investment Bankers and Equity Research Analysts.
Here I have taken Colgate Case Study (2016 to 2020 financials) and calculated Ratios in excel from scratch.
Please note that this Ratio Analysis of the financial statement guide is over 9000 words and took me 4 weeks to complete. To save this page for future reference and don’t forget to share it 🙂
Step 2 – Please note you will get two templates – 1) Unsolved Colgate Model 2) Solved Colgate Model
Step 3- You should start with the Unsolved Colgate Model Template. Follow the step-by-step Ratio Analysis calculation instructions for analysis.
Step 4 – Happy Learning! 🙂
Ratio Analysis – Explained in Video
Vertical Analysis – Balance Sheet
- Vertical Analysis of the Balance Sheet normalizes the Balance Sheet and expresses each item in the percentage of total assets/liabilities.
- It helps us to understand how each item of the balance sheet has moved over the years. For, eg. Did the debt increase or decrease?
- It also helps in the cross-sectional analysis (comparing the balance sheet strength with other comparable companies)
Colgate Case Study
- For each year, Balance Sheet line items are divided by their respective year’s Top Assets (or Total Liabilities) number.
- For example, for Accounts Receivables, we calculate as Receivables / Total Assets. Likewise for other balance sheet items
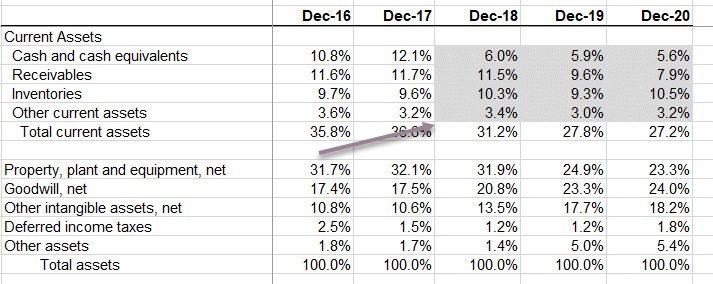
Interpretation of Colgate’s Vertical Analysis
- Cash and Cash equivalents decreased from 10.8% in 2016 and currently stand at 5.6% of the total assets. Why is it reducing?
- Receivables decreased from 11.5% in 2016 to 7.9% in 2020. Does this mean stricter credit policy terms?
- What is included in “other current assets”? It remains stable within 3.2% to 3.6% of the total assets.
- What is included in other assets? Why it is increasing?
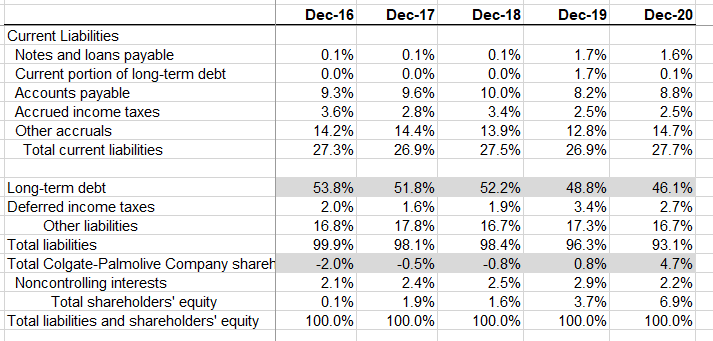
- On the liabilities side, there can be many observations we can highlight. Accounts payable decreased continuously over the few years and currently stands at 8.8% of the total assets.
- Why Long Term Debt as a percentage of liabilities is decreasing over the years. For this, we need to investigate this in the 10K.
- Non controlling interests have remained in the range of 2.1% to 2.9%