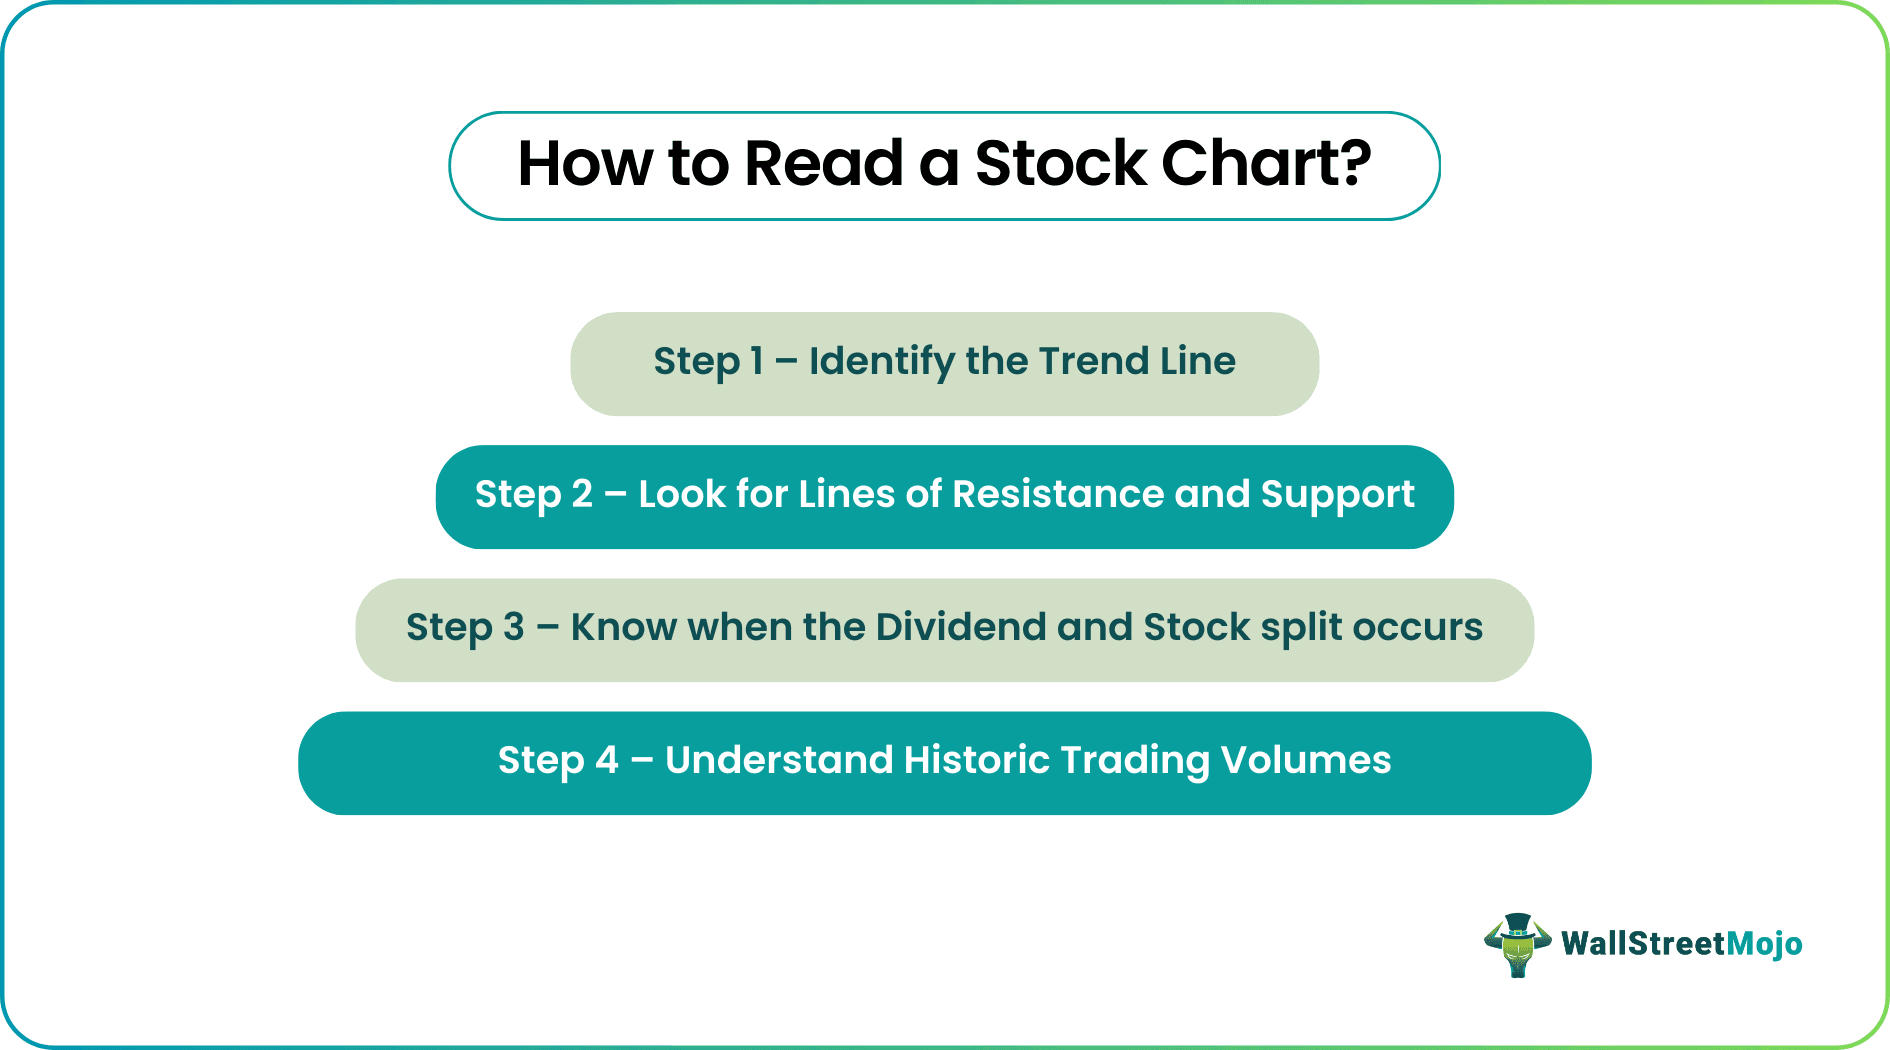
How To Read A Stock Charts?
A stock chart is a pictorial/ graphical representation of a stock price plotted for a period, i.e., daily, weekly, monthly, yearly, etc. It contains items like stock symbol, stock exchange details, price details like open, close, highest, lowest, etc., and trade volume details, i.e., the quantity of stock bought and sold, providing insights about the direction in which stock will be moving.
The essentials of the stock chart need to break down. Then, one should focus on key things by reading the stock chart.
- A stock chart is a graphical or visual representation of the stock price plotted over a specific time frame, such as daily, weekly, monthly, or yearly.
- A stock chart includes stock symbols, stock exchange information, price information such as open, close, highest, and lowest, and trading volume information, i.e., the quantity of stock purchased and sold, which helps predict the direction in which a stock will move.
- The stock chart types are line stock charts, high low, close bar close charts, open high low, close bar stock charts, Japanese candlestick charts, volume at price stock charts, and equivolume stock charts.
Step 1 – Identify the Trend Line
One can see the orange line every time the stock chart goes up or downright. A stock may take huge dives and/ or do huge climbs. But, an investor or trader should not react to large drops or huge gains in negative or positive ways. Rather, one should use this line trend to understand what is happening in the market regarding a particular stock. This trend line helps one to analyze further. Any news related to stock will come and go. Still, when the announcement news coincides, there is a dramatic shift in the trend line that needs attention. Therefore, one should use the trend line to invest in stocks as a high indicator line. Therefore, the trend line should be used to invest in stocks as a high indicator line.

Chart 1
XYZ’s stock price was trading normally, and suddenly on the fifth day, any negative news, say virus entry in the trading country, just got on the TV. Accordingly, the market started reacting negatively to it.
Step 2 – Look for Lines of Resistance and Support
The next step is to read a chart of the resistance and support lines. The levels are the price at which the stock remains for a particular time. The support level is a cost below which stock is improbable to fall. In contrast, the resistance level is the level or price above which a stock price is unlikely to go. The resistance and support level is unlikely to change unless there is a drastic shift in the market, like lower marginal profit. A stock price bounces back and forth between the inflated barriers of support and resistance. The main purpose of resistance and support is to know when to buy and sell a stock. These levels are subjective and can be interpreted differently by different individuals. If a stock holds on for a long time, support and resistance lines may not be very important, but these lines may be crucial for a short-term investor.
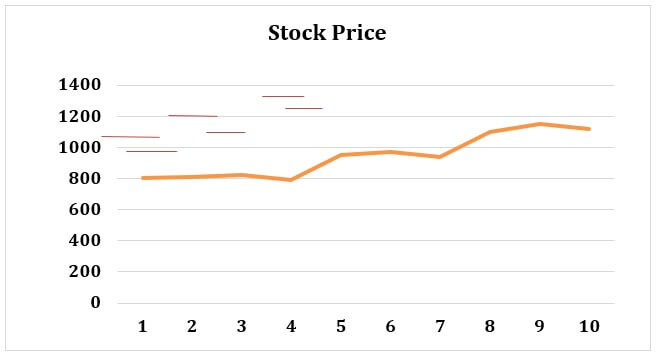
Chart 2
As visible here, red lines are different resistance and support levels over ten days.
Step 3 – Know when the Dividend and Stock split occurs.
At the bottom, in a stock chart, one can see if and when the company has issued a dividend and a stock split. When the company’s Board of Directors opts to provide its earnings share to its shareholders in dividends, the shareholder earns a marginal profit through this dividend. Although all companies do not issue dividends, this should not interpret as not worth investing in if any company does not issue dividends. They consider plenty of other factors. Like some companies prefer to reinvest their earnings rather than give them back to the shareholder, such companies focus on growth.
The company’s board of directors strategically does a stock split to issue additional shares to the public. It does not change the value of the company but changes its price. Generally, companies go for a stock split if the price is not in line with a competitor or attract small investors when the share price decreases.
Chart 3

Here, on day 5, the company announced a dividend payable. After that, stock prices rise as the stock starts trading at a cum-dividend price.
Step 4 – Understand Historic Trading Volumes
At the bottom of the chart, multiple small and vertical lines show the trend of stock traded volume. Any major news about the company, whether good or bad, increases the trading volume. An increase in volume may also shift the price of the stock quickly.
Chart 4

In the above example, the company announced a dividend, and accordingly, one can easily identify a spike in traded volume in the below chart.
Many traders use Saxo Bank International to research and invest in stocks across different markets. Its features like SAXO Stocks offer access to a wide range of global equities for investors.
Types of Stock Chart
The following are the basic types of stock charts: –
- Line Stock Charts: One of the basic charts gives the least information. The line is drawn using the closing price for each unit of time.
- High Low Close Bar Stock Charts: Each bar represents the trading period, with the price being high, low, and close represented.
- Open High Low Close Bar Stock Chart: This illustrates a complete bar chart that includes the open price and close price in the day’s trading.
- Japenese Candlestick Chart: It is widely used in Japan that gives an excellent insight into the current and future price movement.
- Volume At Price Stock Chart: This is the new development in the stock chart that shows the volume of trades at a specific price level.
- Equivolume Stock Charts: These charts provide the volume at a price differently.
Stock Charts Volume
Stock chart volume is the number of shares traded during a time. It is plotted as a histogram under a chart where volume represents the level of interest. If a stock is trading low in volume, there is low interest in the stock market and vice versa. It also describes the liquidity constraint in a stock. Low volume refers to illiquidity, and one can interpret high volume as stock possessing high liquidity. Swing traders use it.
Stock Chart: Resistance Levels
The resistance level in stock charts is the price from which there is no further rise. It is always about the current market price. It is a point on the chart where the traders will expect maximum supply for the stock. It is a technical analysis tool that market participants look at the time of the rising market. It is unlikely that the stock price will rise above the resistance level, consolidate, absorb all the supply, and then see a high decline.
For professional-grade stock and crypto charts, we recommend TradingView – one of the most trusted platforms among traders.
Disclosure: This article contains affiliate links. If you sign up through these links, we may earn a small commission at no extra cost to you.
Frequently Asked Questions (FAQs)
How to read a stock chart for beginners?
The beginners must read a stock chart following the mentioned steps:
One must recognize the chart type.
Choose a time window and note the summary key.
Record the prices, note the volume traded, and then view the moving averages.
How to read a stock chart for dummies?
The dummies must first choose the chart type, period, and range. After that, one must select a color scheme for the chart. One may also see the grids on the screen, which one may set every line’s presentation as dense, solid, or dashed. Next, one may see legends where they view the information about the stocks or other assets, for which one may develop a chart where they can determine how much detail they want to display.
How to read a stock chart on Robinhood?
One may view the price line in the standard or advanced chart view. In addition, it displays how changeable the price was for the selected period. And the large swings up or down show a very volatile price. On the other hand, the small or constant changes apply a relatively stable price heading in one direction at the chosen period.
How do I read a stock chart?
Initially, it would be best to recognize the trendline and then identify the support or resistance lines. Next, you may see the dividend details and the stock split at the bottom of the chart if that ever happened. Then, you must consider and understand the historical trading volumes at the bottom of the chart in the form of small and vertical lines. It indicates a volume trend at which the stock is traded.
Recommended Articles
This article is a guide to How to Read a Stock Chart? Here, we discuss how to interpret trend lines, stock charts volume, and types of stock charts. You may learn more about excel from the following articles: –