Part of our Excel Charts guide
Excel Trend Line
A trendline, often called “the best-fit line,” is a line that shows the trend of the data. As you have seen in many charts, it shows the overall trend or pattern, or direction from the existing data points. Excel provides the option of plotting the trend line on the chart. When we add this trend line to the chart, it looks like a line chart without any ups and downs.
How to Add and Insert Trend Line in Excel?
To add a trendline in Excel, we need to insert the chart for the available data. Before adding a trend line, remember the Excel charts supporting the trendline. For example, we can add a trendline to a column chart, line chart, bar chart, scattered chart or XY chart, stock chart, or .
But we cannot add a trendline to 3-D or stacked charts, radar charts, [wsm-tooltip header=”” description=”The pie chart is a circular excel chart representing the visualization of data in a circular format. In this circular chart, every category of data has its part, and all the categories make it as a whole circular data.” data-wpil=”url” url=”https://www.wallstreetmojo.com/make-pie-chart-in-excel/”], and similar kinds of charts.
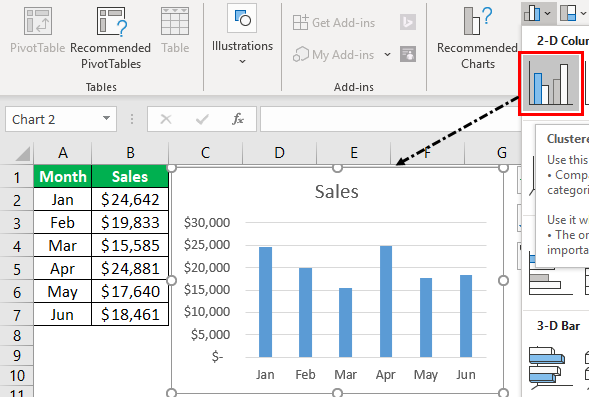
- The best example of plotting a trendline is monthly sales numbers. Below are the monthly sales numbers to create a chart.

- To add a trendline, we need to create a column or line chart in Excel for the above data. Therefore, we will insert a column chart in Excel for this data.

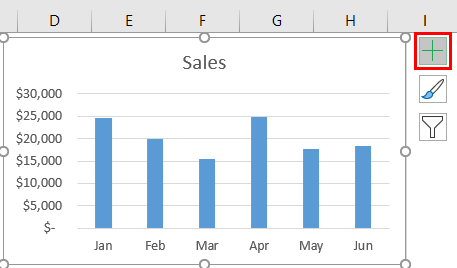
- Once the chart is inserted, adding the trend line is easy in Excel 2013 and the above versions. Select the chart. It will show the PLUS icon on the right side.

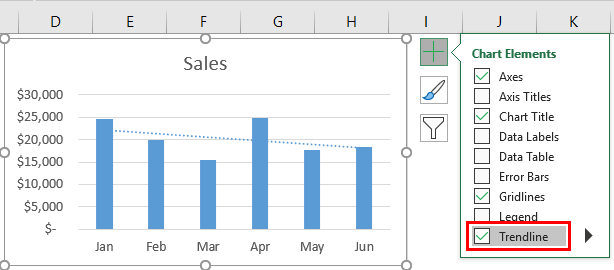
- Click on this PLUS icon to see various options related to this chart. For example, we can see the “Trendline” option at the end of the options. Click on this to add a trend line.

- So, our trendline is added to the chart. If you have inserted the LINE CHART in place of COLUMN CHART, all the steps are the same as inserting the trendline in Excel.
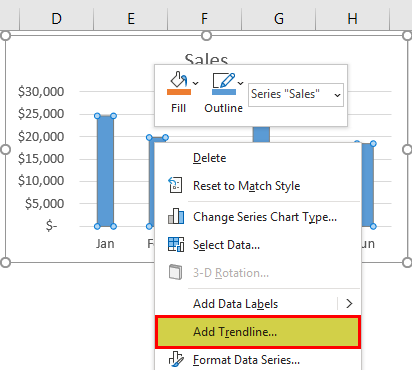
We can also add trend lines in multiple ways. Another way is to select column bars and right-click on the bars to see options. From the options, choose”ADD TRENDLINE.”

It will add the default trend line of “Linear Trend Line.” The best-fit trend line shows whether the data is trending upwards or downwards.
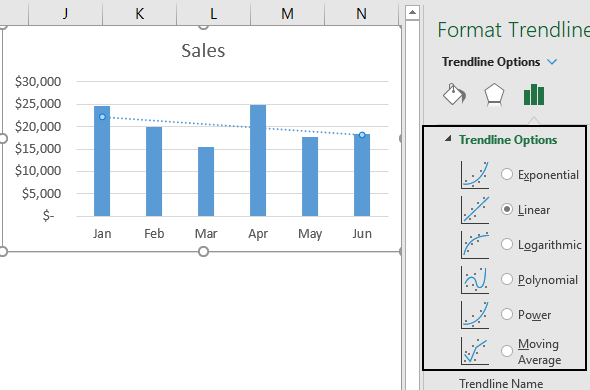
We have several trend line types, below are the types of the trend line.
- Exponential Trendline
- Linear Trendline
- Logarithmic Trendline
- Polynomial Trendline
- Power Trendline
- Moving Average Trendline
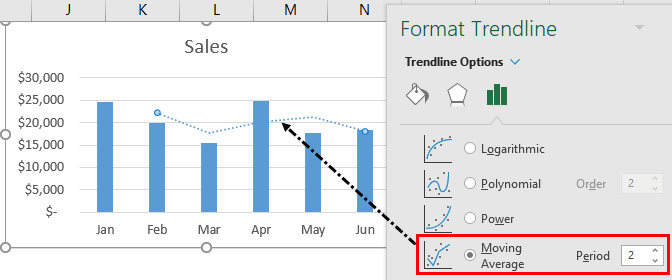
All these trendlines are part of the statistics. One of the other popular trendlines is the “Moving Average” trendline.
The “Moving Average” trendline shows the trend of the average of a specific number of periods. For example, the quarterly trend of the data. Right-click on column bars to apply the moving average trendline and choose “Add Trendline.” It will open the “Format Trendline” window to the right end of the worksheet.
In the above window, choose the “Moving Average” option and set the period to 2. It will add the trendline for the average of every 2 periods.
How to Format the Trendline in Excel Chart?
The default trendline does not have any special effects on the trend line. Therefore, we need to format the trend line to make it more appealing.
Select the trend line and press Ctrl +1. Then, in the “Format Trendline” window, choose “FILL” and “LINE,” make the width 2 pt, and the color dark blue.

This Excel trendline can also forecast the sales numbers for the next months. To do this, go to “Trendline Options, “Forecast,” and make “Forward” to 3 periods.
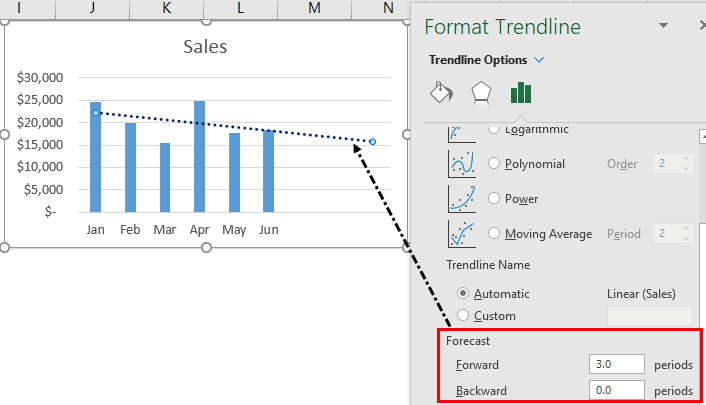
As shown in the above image, we have added a forward trend for 3 periods, increasing the trend line for 3 months.
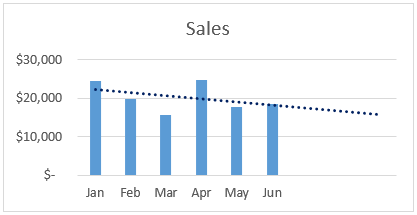
From this chart, our trendline shows a continuous decline in sales numbers.
Things to Remember
- A trendline is a built-in tool in Excel.
- The “Moving Average” trendline shows the average trend line of the mentioned periods.
- We must always format the default trendline to make it more appealing.
Recommended Articles
This article has been a guide to TrendLine in Excel. Here, we learn how to add and insert the trendline in Excel, examples, and a downloadable Excel template. You may learn more about Excel from the following articles: –
Recommended Articles
Continue with these closely related articles from the same guide.