Liquidity Meaning
Liquidity is the ease of converting assets or securities into cash. For handling immediate expenses, firms maintain a proportion of liquid assets—cash, bank balance, marketable securities, and money market instruments. It is a measure that reflects the operational efficiency of an organization.
When converting assets into cash or cash equivalents, firms should do so at a fair market price. Before investing a huge sum in any investment, companies need to ensure adequate liquid assets to meet operating expenses.
Key Takeaways
- Liquidity is a method of interpreting a firm’s proficiency in fulfilling its short-term obligations using cash—acquired from the sale of its current assets at a fair market price.
- Cash ratio, quick ratio, current ratio, and defensive interval ratios measure a company’s financial health.
- Firms possessing more liquid assets have better credibility. They have sufficient working capital and cash reserves—better placed for business growth or expansion.
Liquidity Explained
The meaning of the term liquidity varies depending on the context. Liquidity in financial markets refers to the convertibility of securities and assets into quick cash—without bargaining over market price. These short investments include cash, foreign currency, stocks, commodities, and government investment certificates. In accounting though liquidity refers to a firm’s competence in fulfilling short-term financial obligations.
Investors, shareholders, and credit providers judge a firm based on its liquidity before investing. Liquid assets are readily available in cash—cash equivalents, inventory, and receivables. Fixed assets, goodwill, and trademark are not considered very liquid. Liquid assets should be balanced. Excessive cash or current assets may lead to a liquidity glut with more than the required free capital floating in the business. Such money remains uninvested and doesn’t generate any additional income or benefits.

Video Explanation Of Liquidity

Liquidity Ratios
Following are the different types of financial ratios calculated by organizations to identify their financial well-being:
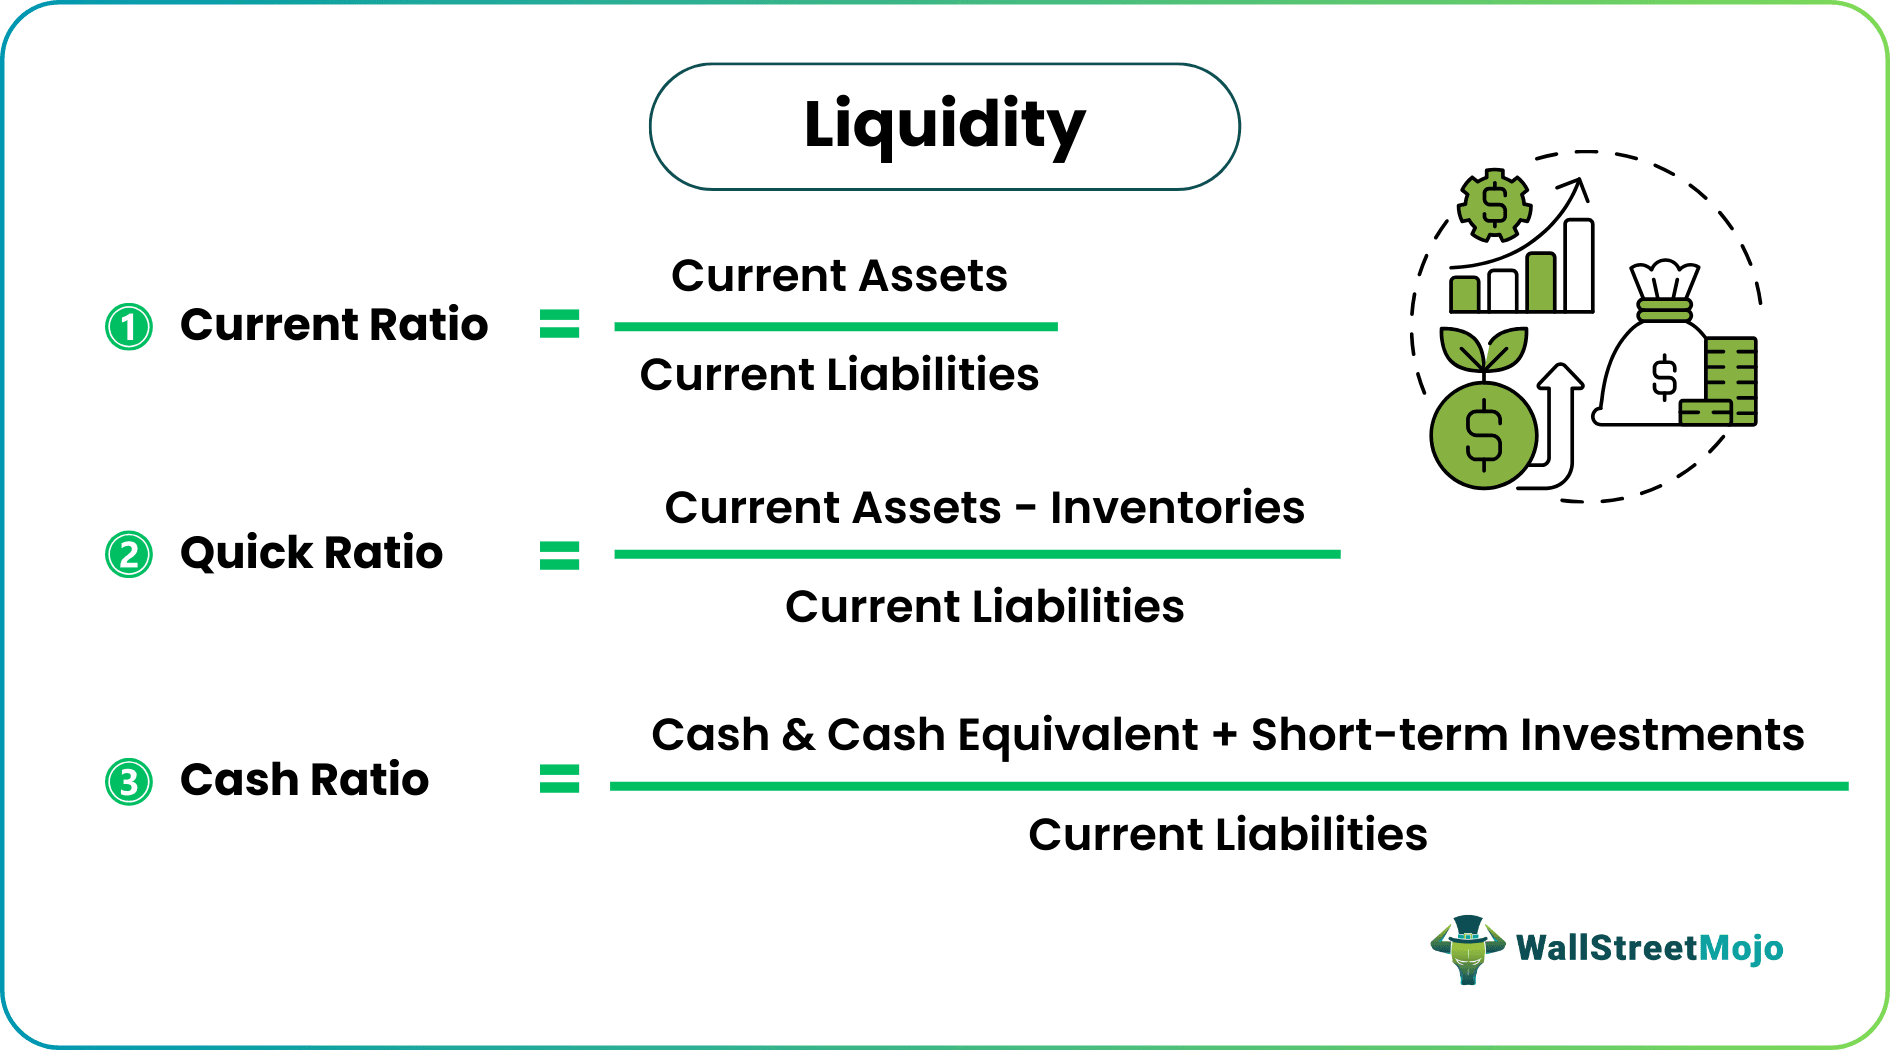
#1 – Current Ratio
The current ratio is a financial measure of an organization’s potential for meeting its current liabilities within a year from its existing assets. The formula is as follows:
Current assets comprise cash and cash equivalents, inventory, accounts receivables, marketable securities, money market instruments, and other assets that can be readily converted into cash. In comparison, current liabilities include short-term debts, outstanding salaries, wages, electricity expenses, rent, taxes, and long-term debt installments.
A proportion of 2:1 defines sound working capital position—proportion varies from industry to industry.
#2 – Quick Ratio
The acid test ratio is a liquidity metric that analyzes the firms’ short-term paying ability from cash, cash equivalents, inventory, and receivables. It is computed as follows.

Now, the ideal acid test ratio is said to be 1:1. Quick assets or liquid assets can be encashed within 90 days—cash, cash equivalents, marketable securities, and accounts receivables.
#3 – Cash Ratio
Cash ratio or absolute liquidity ratio refers to a financial evaluation of a firm’s immediate paying capacity to meet current liabilities. The formula is as follows:

The cash ratio is considered good if it is 0.5:1 or more. It shows that the company has enough ready cash to cover at least half of its short-term obligations.
#4 – Defensive Interval Ratio
The defensive interval ratio/period is the number of days a company can solely survive on its liquid assets and clear operating expenses.

Here,

It indicates a firm’s operating cash flow.
Liquidity Example
Let us consider a numerical problem to understand the practical application of the concept. Given below is the Balance Sheet of MNC Ltd. for the year ending in December 2021:

If the company’s annual operating expenses amount to $200000 and the non-cash expenses are worth $17500, determine the firm’s liquidity.
Solution:
Cash Ratio = Cash and Cash Equivalents/Current Liabilities
Cash Ratio = (45000 + 35000) / 40000 = 2:1
Quick Ratio = (Cash and Equivalents + Marketable Securities + Accounts Receivables)/Current Liabilities
Quick Ratio = (45000 + 35000 + 15000 + 20000) / 40000 = 2.875:1
Current Ratio = Current Assets/Current Liabilities
Current Ratio = (45000 + 35000 + 15000 + 10000 + 20000) / (15000 + 25000) = 125000/40000 = 3.125:1
Defensive Interval Ratio = Current Assets/Daily Operational Expenses.
Daily Operational Expenses = (Annual Operating Expenses – Noncash Charges)/365
Daily Operational Expenses = (200000 – 17500) / 365 = $500
Defensive Interval Ratio = 125000 / 500 = 250 days
Interpretation
- The cash ratio of MNC Ltd. is 2:1. It means, the company’s cash and cash equivalents are twice that of current liabilities—the firm can easily pay off obligations.
- A quick ratio of 2.875:1 is again a sign of healthy financials. In the short run, the company is maintaining adequate amounts of liquid assets.
- A 3.125:1 current ratio signifies that the business’ current assets are three times that of current liabilities—shows cash flow efficiency.
- Also, the defensive interval period is 250 days—commendable for the smooth functioning of the business.
Importance
- Reflects Financial Health: Posesing adequate liquid assets, says a lot about a firm’s competency.
- Ensures Availability of Sufficient Funds: Firms with ample cash and other current assets meet immediate financial obligations with ease. It also indicates that the firm is backed by cash reserves for emergencies.
- Improves Credibility: Whenever the company needs funds for its future projects either through equity issues or debts, the investors and the financiers thoroughly study the availability of liquid assets. For investors, this signifies reduced risk levels.
- Expansion: Since, firms with sufficient working capital and cash reserves have more credibility, they are better placed for business growth or expansion.
Liquidity Management in Business
Liquidity risk is a worst-case scenario where a company is unable to settle its short-term liabilities with available cash and other liquid assets. It shows that the firm is struggling to meet its ends—reasons could be too much debt or an inability to convert credit sales into cash.
Running out of liquid assets is a risk encountered by financial institutions and governments as well—due to strict regulations and huge debts. Therefore, every entity requires liquidity management; banks, governments, and businesses alike.
Banks are mandated to maintain excessive liquid assets under the Dodd-Frank Wall Street Reform and Consumer Protection Act, 2010. In the short run, businesses use various tools and techniques to identify their cash requirements—cash flow modeling, cash forecasting, cash concentration, and notional pooling. For managing the amount of liquid assets, managers focus on conversion costs, conversion time, and the price fluctuations of assets or securities.
Frequently Asked Questions (FAQs)
What is liquidity?
It is a measure of a company’s ability to pay off short-term obligations; using assets that can easily be redeemed into cash without comprising fair market price. Liquid assets include cash, bank balance, marketable securities, money market instruments, accounts receivables, inventory, and precious metals.
What is liquidity risk?
Since quick assets are essential for meeting the immediate liabilities, risk arises when a business runs out of cash or other liquid assets. If that happens, the firm can no longer fulfill its financial obligations.
What do liquidity ratios measure?
These ratios are crucial financial metrics used for understanding operational efficiency. They analyze a firm’s cash availability and current account position— current ratios, cash ratios, quick ratios, and defensive interval ratios.
Recommended Articles
This article has been a guide to what is liquidity and its meaning. Here we explain liquidity ratios, examples, interpretation, importance, and management. You can learn more about corporate finance from the below articles –