What is Statistical Analysis?
Statistical analysis refers to the analysis of data collected to derive patterns, trends, or other meaningful conclusions. It involves the use of statistical methods of data analysis. The two main types are descriptive statistics and statistical interference.
Any given scenario can possess raw data sets; organizing and analyzing it by giving importance to each element present is vital. It helps deduce important values or future outcomes, makes the decision-making process less complex and provides a better view of the scenario.
Key Takeaways
- Statistical analysis refers to the collection and analysis of data by forming statistics to derive meaningful information, which becomes useful in effective decision-making.
- Important types are descriptive analysis, inferential analysis, predictive analysis, prescriptive analysis, exploratory data analysis (EDA), and causal analysis.
- The five basic methods are mean, standard deviation, regression, hypothesis testing, and sample size determination.
- It is widely used by governments, businesses, banking entities, insurance companies, etc.
Statistical Analysis Explained
Statistical analysis is done on data sets, and the analysis process can create different output types from the input data. For example, the process can give summarized data, derive key values from the input, present input data characteristics, prove a null hypothesis, etc. The output type and format vary with the analysis method used.
It is highly used by governments and management professionals in the business world. It helps professionals like analysts to understand complex scenarios and the vast data associated with them. Statistical analysis data is important in politics, generating information that fuels political theory, campaign strategy, and policy development.
Various statistical analysis softwares forming subcategories of business intelligence tools are available to make the analysis process easy. Examples are Microsoft Excel (Analysis Toolpak), SPSS (Statistical Package for the Social Sciences), MATLAB, and SAS (Statistical Analysis Software).
Statistical Analysis Types
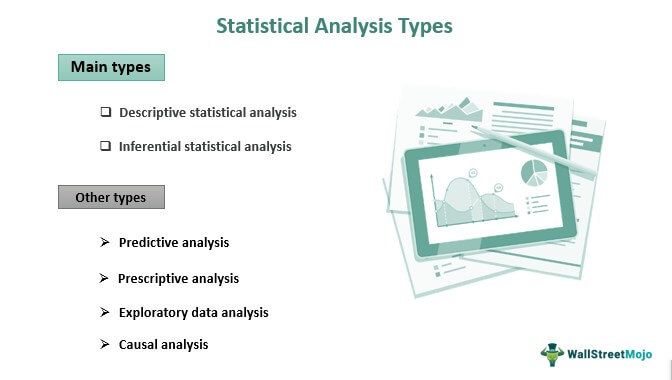
The two main types are descriptive statistics and inferential statistics.
- Descriptive statistics: It refers to collecting, organizing, analyzing, and summarizing data sets in an understandable format, like charts, graphs, and tables. It makes a large data set presentable and eliminates complexity to help analysts understand it. The format of the summary can be quantitative or visual.
- Inferential statistics: Inferential statistics derive inference about a large population. It is based on the analysis and findings produced for sample data from the large population. Hence it makes the process cost-efficient and time-efficient. It generally includes the development of interval estimate, and points estimate to conduct the analysis.
Some other types are the following:
- Predictive analysis: This analysis is used to forecast future events based on past and present data. It uses machine learning tools, data mining, big data, predictive modeling, artificial intelligence, and simulations.
- Prescriptive analysis: This analysis aims to prescribe the best possible outcome based on the assessed data. It helps make informed decisions and encourages efficient decision-making.
- Exploratory data analysis (EDA): In statistics, this method studies data sets to highlight their major features, which is frequently done using statistical graphics and other data visualization approaches.
- Causal analysis: It focuses on the cause and effect. In simple terms, it focuses on the crux of events occurring and the reason behind them; based on data analysis, it aids in understanding why something didn’t work out and failures in business and professional activities.
Methods of Statistical Analysis
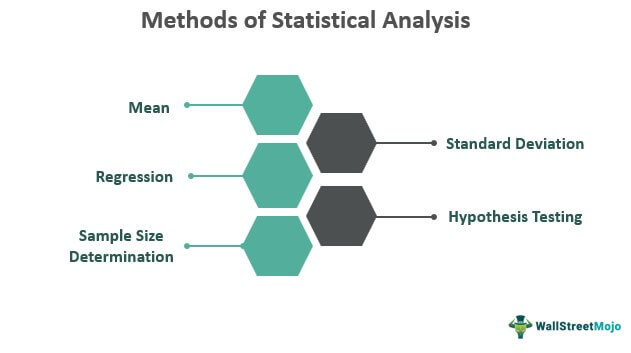
Mean
It is one of the simplest and most popular analysis methods easy to apply to data. The mean is the average value of data used in research. In statistics, the term “mean” is commonly used to indicate average. It is calculated by adding the data values and dividing them by the total number of data points. Though it is a common method, it is advised to have other methods supporting it for effective decision-making.
Standard Deviation
Standard deviation is a common statistical analysis tool to determine the deviation of a set of values from the mean value. The standard deviation value will be low if the deviation from the mean is small and vice versa.
Regression
The regression method helps comprehend the relationship between two or more variables used in the analysis. It shows how one variable is dependent on the other and their inter effect on each other. There is simple linear regression using a single independent variable to interpret the dependent variable and multiple linear regression using multiple independent variables to interpret the outcome.
Hypothesis Testing
The method tests the validity and authenticity of a hypothesis, outcome, or argument. Hypothesis testing is an assumption set at the beginning of the research; after the test is over and a result is obtained based on it, the belief can be either true or false. In addition, it can check whether the null hypothesis or alternative hypothesis is true.
Sample Size Determination
The technique derives a sample from the entire population, representing the total population. When there is a large data set, and the analysis gets challenging, a small sample is taken for study and research.
Example
In a class, there are nine students, and the table given below contains the result of their math tests. Using the analysis method – “mean” summarizes the entire data by finding the mean of marks scored by the class.
| Students | Score out of 100 |
|---|---|
| A1 | 45 |
| B2 | 18 |
| C3 | 54 |
| D4 | 72 |
| E5 | 81 |
| F6 | 36 |
| G7 | 63 |
| H8 | 99 |
| I9 | 90 |
Mean = Sum of all data points / Number of data points
= 558/9
= 62
Hence, the mean of marks scored by nine students is 62.
Frequently Asked Questions (FAQs)
What are the types of statistical analysis?
The process generally involves the examination of data collected to derive relevant conclusions. Some of the types are:
- Descriptive statistics
- Inferential statistics
- Predictive analysis
- Prescriptive analysis
- Exploratory data analysis (EDA)
- Causal analysis
What are the five basic methods of statistical analysis?
The five basic methods are:
- Mean
- Standard deviation
- Regression
- Hypothesis testing
- Sample size determination
Explain statistical analysis in Excel?
Excel provides many statistical functions and analytical tools, which are key aspects. Its application is appropriate to have a better grasp of data. The Excel Analysis Toolpak is a plug-in that adds different analysis techniques to Excel. Excel provides options for descriptive analysis, ANOVA (Analysis Of Variance), moving average, regression, sampling techniques, etc.
Recommended Articles
This has been a Guide to What is Statistical Analysis. We explain the statistical analysis of data, its methods, types, software, and examples. You can learn more from the following articles –