What Is Multiple Regression Formula?
Multiple regression formulas analyze the relationship between dependent and multiple independent variables. For example, the equation Y represents the formula is equal to a plus bX1 plus cX2 plus dX3 plus E where Y is the dependent variable, and X1, X2, and X3 are independent variables. A is the intercept, b, c, and d are the slopes, and E is the residual value.
Multiple regressions are a very useful statistical method. Regression plays a very important role in the world of finance. A lot of forecasting is done using regression analysis. For example, one can predict the sales of a particular segment in advance with the help of macroeconomic indicators that have a very good correlation with that segment.
Key Takeaways
- Multiple regression formulas are used to analyze the relationship between a dependent variable and multiple independent variables.
- This method uses two or more independent variables to forecast or predict the dependent variable.
- The main objective is to identify and examine the relationship between the dependent and independent variables. Based on this analysis, suitable independent variables are selected to aid in predicting the dependent variable.
- Multiple regression is employed when linear regression alone cannot fulfill the intended purpose, and it helps determine the effectiveness of the chosen predictor variables in forecasting the dependent variable.
Multiple Regression Formula Explained
Multiple regression model formula are a method to predict the dependent variable with the help of two or more independent variables. While running this analysis, the main purpose of the researcher is to find out the relationship between the dependent and independent variables. The multiple independent variables are chosen, which can help predict the dependent variable to predict the dependent variable. One may use it when linear regression cannot serve the purpose. The regression analysis helps in the process of validating whether the predictor variables are good enough to help in predicting the dependent variable.
y = mx1 + mx2+ mx3+ b
Where,
- Y= the dependent variable of the regression
- M= slope of the regression
- X1=first independent variable of the regression
- The x2=second independent variable of the regression
- The x3=third independent variable of the regression
- B= constant
The main aim of this method of multiple regression model formula is to estimate the coefficients that reduce or minimize the sum of squared differences between the values of Y and the values that are predicted by the equations. Various software packages used for statistical purposes can perform this analysis systematically because they are designed to handle complex calculations within a limited timeframe and provide statistical evaluation of the accuracy.
Examples
Let us understand the concept of multiple regression analysis formula with the help of suitable examples.
Example #1
Let us try and understand the concept of multiple regression analysis with the help of an example. But, first, let us try to find out the relation between the distance covered by an UBER driver and the age of the driver, and the number of years of experience of the driver.

To calculate multiple regression, go to the “Data” tab in Excel and select the “Data Analysis” option. For further procedure and calculation, refer to the: Analysis ToolPak in Excel article.
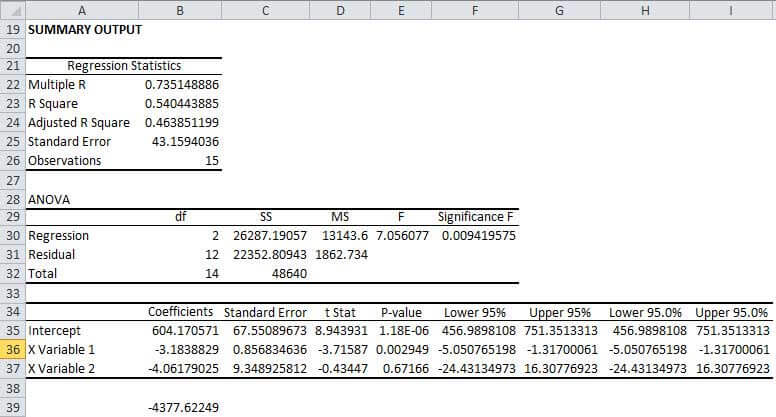
The regression formula for the above example will be
- y = MX + MX + b
- y= 604.17*-3.18+604.17*-4.06+0
- y= -4377
In this particular example of multiple regression analysis formula, we will see which variable is the dependent variable and which variable is the independent variable. The dependent variable in this regression equation is the distance covered by the UBER driver, and the independent variables are the age of the driver and the number of experiences he has in driving.
Example #2
Let us try and understand the concept of multiple regression analysis with the help of another example. Let us try to find the relation between the GPA of a class of students, the number of hours of study, and the student’s height.

Go to the “Data” tab in Excel and select the “Data Analysis” option for the calculation.

The regression equation for the above example will be
y = MX + MX + b
y= 1.08*.03+1.08*-.002+0
y= .0325
In this particular example, we will see which variable is the dependent variable and which variable is the independent variable. The dependent variable in this regression is the GPA, and the independent variables are study hours and the height of the students.
Example #3
Let us try and understand the concept of multiple regression analysis with the help of another example. Now, let us find out the relation between the salary of a group of employees in an organization, the number of years of experience, and the age of the employees.

Go to the “Data” tab in Excel and select the “Data Analysis” option for the calculation.

The regression equation for the above example will be
- y = MX + MX + b
- y= 41308*.-71+41308*-824+0
- y= -37019
In this particular example, we will see which variable is the dependent variable and which variable is the independent variable. The dependent variable in this regression equation is the salary, and the independent variables are the experience and age of the employees.
Thus, the above examples successfully explain the formula and the concept by using different case studies to highlight the various areas of study where it can be applied and used to derive suitable results that can be easily interpreted.
Relevance And Uses
Let us look at some of the uses of the concept.
- This concept is widely used for prediction of the values of the dependent variables with relation to the values of independent variables. Some examples of such situations can be prediction of share prices, sales value and students performance over a period of time. In this way it can also help in assessing the relation between many or multiple variables.
- Multiple regression model equation can be used to isolate and identify any particular factor that can impact one variable while other variables constant.
- It can successfully capture the relationships between both the dependent and independent variables which are complex, not linear in nature and and includes more than one predictor.
- Businesses can take decisions based on the outcome of this calculation related to employee performance, sales figures, customer demand and satisfaction levels, etc.
- Any business is subject to a number of risks related to market movements, demand, supply, prices, material availability and many more. In such cases this concept and calculation can be used by the finance and insurance companies to assess the return or the claim that they may have to handle to cover such risks.
- Companies use the method of multiple regression model equation to assess the extent to which the company’s marketing efforts are impacting the revenue and profits, which is helpful for both the stakeholders and the management to make crucial decisions. The method also helps establish relationships between important variables like the GDP, employment, and inflation, which are essential factors that every country’s government needs to look into for all round development of the economy.
- It helps in quality control and also generate process improvement ideas that contribute to the upgradation of the standard of the products and services of the organization.
Thus, we see that the concept has a number of uses in the financial as well as statistical field. It uses complex datasets and helps businesses generate business models or take complex financial and other type of decisions that guides the business towards a smooth operational process. It is necessary to use the procedure in the correct manner to get proper result.
Frequently Asked Questions (FAQs)
Can multiple regression formulas use categorical variables?
Yes, the multiple regression formula can handle categorical variables. Techniques like dummy coding or effect coding can be used to represent categorical variables as a set of binary (dummy) variables. These transformed variables are then included in the regression analysis to assess their impact on the dependent variable.
What are the limitations of the multiple regression formula?
The limitations of multiple regression include the assumptions of linearity, independence of observations, normality of errors, absence of multicollinearity, and homoscedasticity. Violations of these assumptions can lead to biased or inefficient estimates and affect the validity of the regression model’s predictions.
What are the benefits of the multiple regression formula?
Multiple regression offers several benefits. It allows for quantifying the relationships between multiple independent variables and a dependent variable. It helps identify significant predictors and control for confounding factors. It enables predictions and forecasts based on the regression equation. Additionally, it provides insights into the strength and direction of relationships between variables.
Recommended Articles
This article has been a guide to what is Multiple Regression Formula. We explain it with some suitable examples and the relevance and uses of the same. You can learn more about statistical modeling from the following articles: –