Part of our Regression Analysis guide
What Is Least Squares Regression?
A least-squares regression method is a form of regression analysis that establishes the relationship between the dependent and independent variables along a linear line. This line refers to the “line of best fit.”
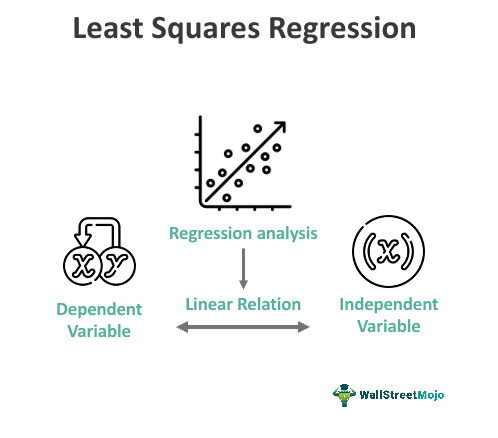
Regression analysis is a statistical method with the help of which one can estimate or predict the unknown values of one variable from the known values of another variable. The variable used to predict the variable interest is called the independent or explanatory variable, and the variable predicted is called the dependent or explained variable.
Key Takeaways
- Least-squares regression is a statistical method used to establish a linear relationship between a dependent variable and one or more independent variables.
- The objective of least-squares regression is to determine the line of best fit that minimizes the sum of squared differences between the observed data points and the predicted values.
- Least-squares regression is commonly used in various fields, including finance, economics, social sciences, and engineering, to analyze data, make predictions, and understand relationships between variables.
- More specific computational techniques, such as nonlinear regression or polynomial regression, may be employed for nonlinear equations.
Least Squares Regression Explained
The concept of least square regression is a mathematical process of regression analysis of a set of data that shows their relationship with each other. It shows the line of best fit, which is a graphical representation of all the data points that fit best in a straight line.
The ordinary least squares regression is a visual representation which shows the relation between an independent variable that is known and a dependent variable which is unknown. It is extremely popular and widely used by analysts, mathematicians, and even traders and investors to identify price and performance trends and also spot opportunities for investment.
Let us consider two variables, x and y. These are plotted on a graph with values of x on the x-axis and y on the y-axis. The dependent variables are all plotted on the y-axis and independent variables are on the x-axis. The dots represent these values in the below graph. A straight line is drawn through the dots – referred to as the line of best fit.

The objective of least squares regression is to ensure that the line drawn through the set of values provided establishes the closest relationship between the values.
Through this method, the behavior of the dependent variables can be analysed and predicted which is useful in the financial market. This linear relationship helps in reducing the vertical distance between the straight regression line and the data points. The least square explains the least value of summation of the squares of each error, which is also known as variance. Many statistical and mathematical software programs use this method.
Formula
The regression line under the least squares method one can calculate using the following formula:
ŷ = a + bx
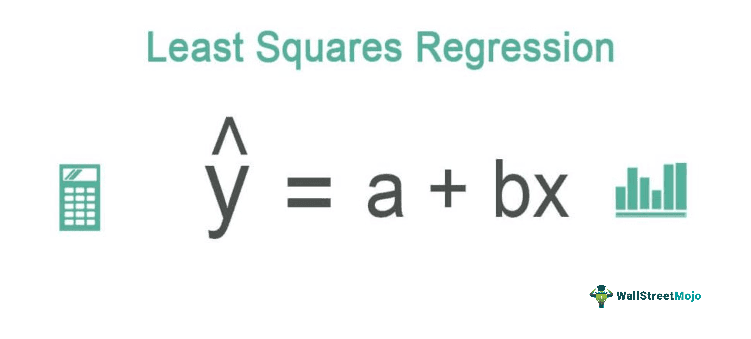
Where,
- ŷ = dependent variable
- x = independent variable
- a = y-intercept
- b = slope of the line
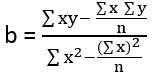
One can calculate the slope of line b using the following formula:
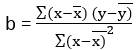
Or
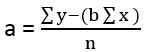
Y-intercept, ‘a’ is calculated using the following formula:
Line of Best Fit in the Least Square Regression
The line of best fit is a straight line drawn through a scatter of data points that best represents the relationship between them.
Let us consider the following graph wherein a data set plot along the x and y-axis. These data points represent using the blue dots. Three lines are drawn through these points – a green, a red, and a blue line. The green line passes through a single point, and the red line passes through three data points. However, the blue line passes through four data points, and the distance between the residual points and the blue line is minimal compared to the other two lines.

In the above graph, the blue line represents the line of best fit as it lies closest to all the values and the distance between the points outside the line to the line is minimal (the distance between the residuals to the line of best fit – also referred to as the sums of squares of residuals). However, in the other two lines, the orange and the green, the distance between the residuals and the lines is greater than the blue line.
The least-squares method provides the closest relationship between the dependent and independent variables by minimizing the distance between the residuals, and the line of best fit, i.e., the sum of squares of residuals is minimal under this approach. Hence, the term “least squares.”
Examples
Let us apply these formulae of ordinary least squares regression to the below question:
Example #1
The details about technicians’ experience in a company (in several years) and their performance rating are in the table below. Using these values, estimate the performance rating for a technician with 20 years of experience.
| Experience of Technician (in Years) | Performance Rating |
|---|---|
| 16 | 87 |
| 12 | 88 |
| 18 | 89 |
| 4 | 68 |
| 3 | 78 |
| 10 | 80 |
| 5 | 75 |
| 12 | 83 |
Solution –
To calculate the least squares first, we will calculate the Y-intercept (a) and slope of a line(b) as follows:

The slope of Line (b)

- b = 6727 – [(80*648)/8] / 1018 – [(80)2/8]
- = 247/218
- = 1.13
Y-intercept (a)

- a = 648 – (1.13)(80) /8
- = 69.7
The regression line is calculated as follows:

Substituting 20 for the value of x in the formula,
- ŷ = a + bx
- ŷ = 69.7 + (1.13)(20)
- ŷ = 92.3
The performance rating for a technician with 20 years of experience is estimated to be 92.3.
Example #2
Least Squares Regression Equation Using Excel
One can compute the least-squares regression equation using Excel by the following steps:
- Insert data table in excel.

- Insert a scatter graph using the data points.

- Insert a trendline within the scatter graph.

- Under trendline options – select linear trendline and select “Display Equation on chart.”

- The least-squares regression equation for the given set of Excel data is displayed on the chart.

Thus, one can calculate the least-squares regression equation for the Excel data set. Predictions and trend analyses one may make using the equation. Excel tools also provide detailed regression computations.
The above examples clearly show through some practical scenarios how the method of least squares regression line is implemented and how we can derive the result and analyse them to our advantage.
Assumptions
Some common assumptions of the method are as follows:
- The process of least squares regression line assumes that the data points are independent of each other and are in no way related or influenced by each other. However, this is quite unlikely in many situations in real life.
- Next, the method assumes that the residuals are in normal distribution. This means that the errors between the observed values are distributed normally around zero.
- It is assumed that there is no multicollinearity among the independent variables, which means there is no correlation between them. Therefore there is no problem in determining the effect of the independent variables on the dependent ones.
- A linear relationship is assumed between the independent variables and the dependent ones, which means if there is a change in the independent ones, there should also be a proportionate change in the dependent variables.
Thus, the above are some important assumptions of the analysis. If these assumptions are not in place the outcome may be affected making it unreliable and inaccurate.
Advantages
This statistical concept of least squares regression method also has some advantages and disadvantages. Let us look at the advantages first.
- The least-squares regression analysis method best suits prediction models and trend analysis. One may best use it in economics, finance, and stock markets, wherein the value of any future variable is predicted with the help of existing variables and the relationship between them.
- The least-squares method provides the closest relationship between the variables. The difference between the sums of squares of residuals to the line of best fit is minimal under this method.
- The computation mechanism is simple and easy to apply.
Disadvantages
The disadvantages of the concept of least squares regression method is as mentioned below.
- The least-squares method establishes the closest relationship between a given set of variables. The computation mechanism is sensitive to the data, and in case of any outliers (exceptional data), results may affect majorly.
- This type of calculation is best suited for linear models. For nonlinear equations, applied more exhaustive computation mechanisms.
- The least squares regression analysis takes into consideration the effect of only two variables. If there are more than two in an analysis, then this process will not work.
It is necessary to understand the pros and cons of any concept in details so that they can be implemented as and when appropriate, and required after clearly identifying whether the purpose will be served as anticipated or not.
The least-squares method is one of the most popular prediction models and trend analysis methods. When calculated appropriately, it delivers the best results.
Least Square Regression Vs Linear Regression
Both the above are related statistical methods of data analysis. But there is a difference between them.
- The least squares regression analysis is a particular technique or process that is actually a part of the latter. It can be said that the former is a subset of the latter.
- The aim of the former is to reduce or minimize the summation of the squares of differences within the observed dependent variable values. The aim of the latter is only to find the relation between two variables, which can be done using any method, including the least square.
Therefore, both the terms are closely related to each other, except the fact that the latter will represent many methods, including the former.
Frequently Asked Questions (FAQs)
What are the applications of least-squares regression?
Least-squares regression finds applications in various fields, such as finance (stock price prediction), economics (demand forecasting), social sciences (correlation analysis), and engineering (data modeling), where understanding and predicting relationships between variables is essential.
What is the relevance of least-squares regression?
Least-squares regression is relevant as it identifies a linear relationship between variables, providing insights into how changes in independent variables affect the dependent variable. It is widely used for predictive modeling and statistical analysis, facilitating data-driven decision-making and hypothesis testing.
What is Partial Least Squares (PLS) regression?
Partial Least Squares (PLS) regression is a technique used when there are multiple independent variables or when there is multicollinearity among them. PLS regression combines principal component analysis and least-squares regression to create a model that captures the relationships between variables while dealing with issues of multicollinearity. It is commonly used in fields such as chemometrics and marketing research.
Recommended Articles
This article is a guide to what is Least Squares Regression. We explain the formula, assumption, examples, differences with linear regression, advantage. You can learn more from the following articles: –
Recommended Articles
Continue with these closely related articles from the same guide.