What Is Regression Formula?
The regression formula assesses the relationship between the dependent and independent variables and finds out how it affects the dependent variable on the change of the independent variable. It is represented by equation Y is equal to aX plus b where Y is the dependent variable, a is the slope of the regression equation, x is the independent variable, and b is constant.
Regression analysis widely used statistical methods to estimate the relationships between one or more independent variables and dependent variables. Regression is a powerful tool as it assesses the strength of the relationship between two or more variables. Then one would use it to model the future relationship between those variables.
Y=a + bX + ∈
a= (Σy)(Σx2) – (Σx)(Σxy)/ n(Σx2) – (Σx)2 b= n (Σxy) – (Σx)(Σy) /n(Σx2) – (Σx)2
Key Takeaways
- The regression formula is used to analyze the relationship between dependent and independent variables and determine how independent variable(s) changes affect the dependent variable.
- The formula is typically represented as Y = aX + b, where Y represents the dependent variable, a represents the slope of the regression equation, X denotes the independent variable, and b represents a constant term.
- Regression analysis finds various applications in finance, such as in the Capital Asset Pricing Model (CAPM), where it helps estimate the expected return on investment based on its systematic risk.
Regression Formula Explained
The regression formula in statistics is a method to estimate or calculate the relation between two or more variables. It specifically helps determine how much a dependent variable (Y) is affected by one or more independent variables (X), where:
- Y – is the dependent variable
- X – is the independent (explanatory) variable
- a – is the intercept
- b – is the slope
- ∈ – and is the residual (error)
The formula for intercept “a” and the slope “b” can be calculated per below.
Regression analysis, as mentioned earlier, is majorly used to find equations that will fit the data. Linear analysis is one type of regression analysis. For example, the equation for a line is y = a + bX. Y is the dependent variable in the formula, which one tries to predict what will be the future value if X, an independent variable, changes by a certain value. The “a” in the formula is the intercept. It means that the value remains fixed irrespective of changes in the independent variable. The term ‘b’ in the formula is the slope which signifies how much the dependent variable is upon the independent variable.
Types
There are different types of formula for regression formula in statistics. However, some common types are given below:
- Simple linear regression – This is a case where there is a linear relation among the independent and dependent variable. The formula is Y = a + b X , in which Y is dependent, X is independent, b is slope and a is intercept.
- Multiple linear regression – This is a case where there is a linear relation between one dependent variable (Y) and many independent variable (X1, X2…. Xn). The formula is Y = a + b1X1 + b2X2 + … + bnXn, where a is intercept and b1, b2, etc are the slopes.
- Polynomial Regression – In this case the independent and the dependent variables are not related to each other in a linear manner. A polynomial function can be used in the formula Y = a + b1X + b2X^2 + … + bnx^n.
- Time series regression – In the case of the time series regression formula, the data is dependent on time, and the relation between the independent ad dependent variables changes with time. The time series regression formula accounts for the structure of the time series and may include some time-related variables.
- Logistics regression – This case has a dependent categorical variable, and the independent variable is either categorical or continuous. A logistic function is used to find the relation between the independent variable and the probability of getting a particular outcome.
The above are some formulas related to regression that is used and applied commonly.
Examples
Let us understand the concept with some regression formula example.
Example #1
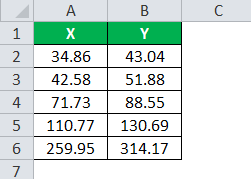
Consider the following two variables x and y, you are required to do the calculation of the regression.
Solution:
Using the above formula, we can calculate linear regression in excel as follows.
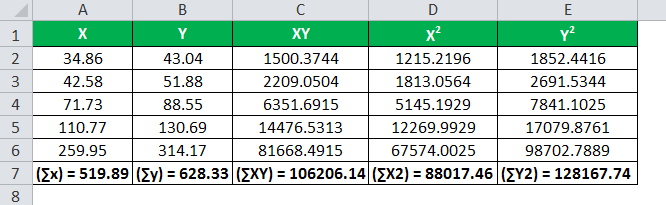
We have all the values in the above table with n = 5.
Now, first, calculate the intercept and slope for the regression.
Calculation of Intercept is as follows,
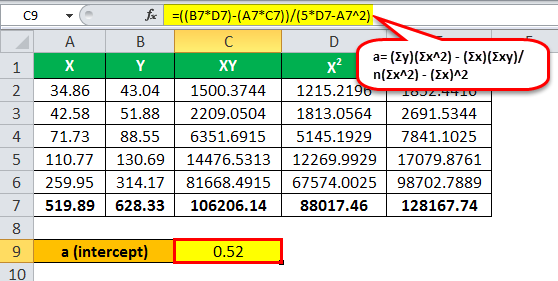
a = ( 628.33 * 88,017.46 ) – ( 519.89 * 106,206.14 ) / 5* 88,017.46 – (519.89)2
a = 0.52
Calculation of Slope is as follows,
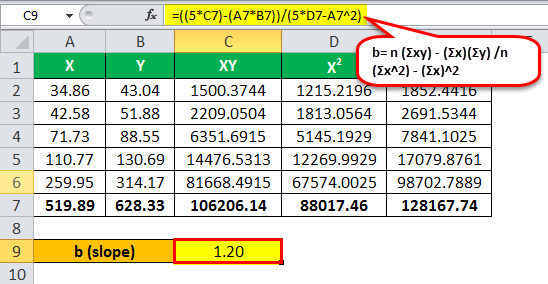
b = (5 * 106,206.14) – (519.89 * 628.33) / (5 * 88,017.46) – (519,89)2
b = 1.20
Let’s now input the values in the regression formula to get regression.
Hence the regression line Y = 0.52 + 1.20 * X. Alternatively, instead of calculating manually or to verify your result after using Excel, you can use a linear regression calculator to quickly find the values and confirm the regression equation.
Example #2
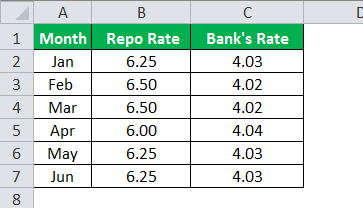
Let us take another regression formula example, where the State Bank of India recently established a new policy linking savings account interest rates to Repo rates. Therefore, the auditor of the State Bank of India wants to conduct an independent analysis of the decisions taken by the bank regarding interest rate changes and whether those have been changed whenever there have been changes in the Repo rate. Therefore, the following is the summary of the Repo rate and Bank’s savings account interest rate that prevailed in those months are below.
The State Bank of India auditor has approached you to conduct an analysis and provide a presentation on the same in the next meeting. Use the regression formula and determine whether the bank’s rate changed as and when it changed the Repo rate.
Solution:
Using the formula discussed above, we can calculate linear regression in Excel. Treating the Repo rate as an independent variable, i.e., X, and treating Bank’s rate as the dependent variable as Y.
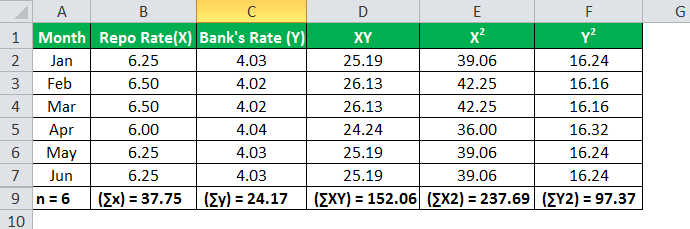
We have all the values in the above table with n = 6.
Now, first, calculate the intercept and slope for the regression.
Calculation of Intercept is as follows,
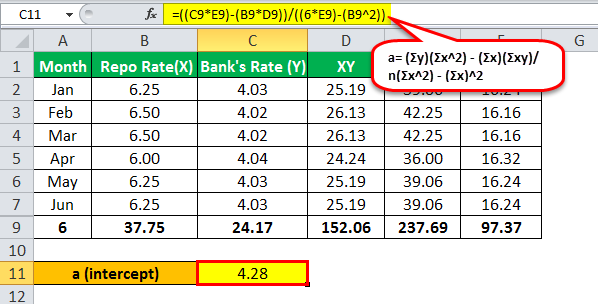
a = ( 24.17 * 237.69 ) – ( 37.75 * 152.06 ) / 6 * 237.69 – (37.75)2
a = 4.28
Calculation of Slope is as follows,
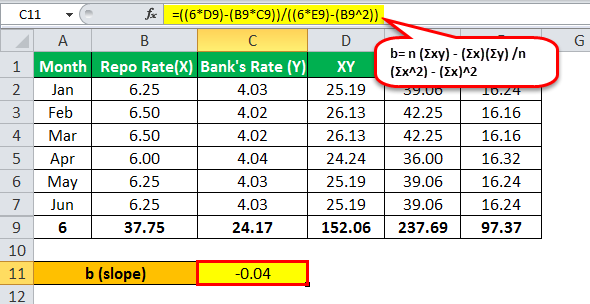
b = (6 * 152.06) – (37.75 *24.17) / 6 * 237.69 – (37.75)2
b= -0.04
Let’s now input the formulas’ values to arrive at the figure.
Hence, the regression line Y = 4.28 – 0.04 * X.Analysis: The State Bank of India is indeed following the rule of linking its saving rate to the repo rate, as some slope value signals a relationship between the repo rate and the bank’s saving account rate.
Example #3
ABC laboratory is researching height and weight and wanted to know if there is any relationship, like as the height increases, the weight will also increase. So, they gathered a sample of 1,000 people for each category and found an average height in that group.
Below are the details that they have gathered.
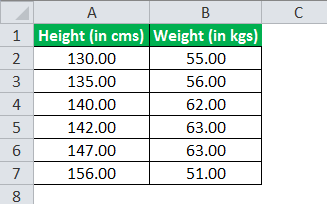
You are required to do the calculation of regression and come up with the conclusion that any such relationship exists.
Solution:
Using the formula discussed above, we can calculate linear regression in Excel. Treating height as an independent variable, i.e., X, and weight as the dependent variable as Y.
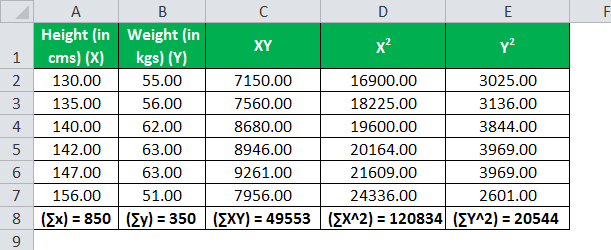
We have all the values in the above table with n = 6
Now, first, calculate the intercept and slope for the regression.
Calculation of Intercept is as follows,
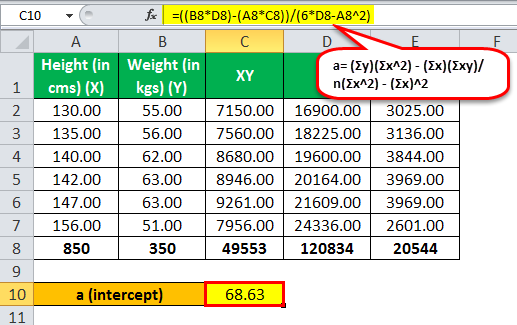
a = ( 350 * 120,834 ) – ( 850 * 49,553 ) / 6 * 120,834 – (850)2
a = 68.63
Calculation of Slope is as follows,
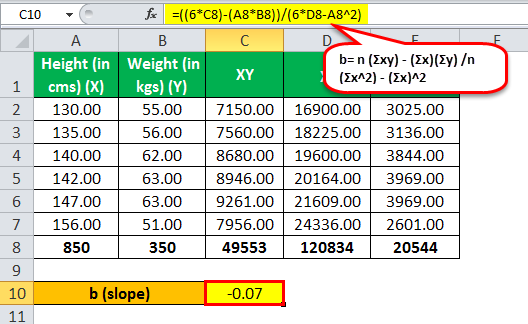
b = (6 * 49,553) – (850 *350) / 6 * 120,834 – (850)2
b = -0.07
Let’s now input the values in the formula to arrive at the figure.
Hence the regression line Y = 68.63 – 0.07 * X
Analysis: There is a significant, less relationship between height and weight, as the slope is very low.
Uses
This regression formula in research has some very important uses. When a correlation coefficient depicts that data can predict future outcomes. Along with that, a scatter plot of the same dataset appears to form a linear or a straight line. One can use the simple linear regression by using the best fit to find a predictive value or predictive function. The regression analysis has many applications in finance as it is used in CAPM, the capital asset pricing model a method in finance. One can use regression formula in research to forecast the revenue and expenses of the firm.
Frequently Asked Questions (FAQs)
What are the assumptions associated with the regression formula?
The assumptions associated with the regression formula include linearity, independence, homoscedasticity, normality, and no multicollinearity. Linearity assumes that the relationship between the independent and dependent variables is linear. Independence assumes that observations are not influenced by each other. Homoscedasticity assumes that the variance of the errors is constant across all levels of the independent variables. Normality assumes that the errors follow a normal distribution. No multicollinearity assumes that the independent variables are not highly correlated.
What are the benefits of applying the regression formula?
Applying the regression formula provides several benefits. It allows for identifying and quantifying relationships between variables, enabling a better understanding of how changes in independent variables impact the dependent variable. The regression formula also facilitates prediction and forecasting, as it can be used to estimate future outcomes based on the established relationships in the model.
What are the limitations of the regression formula?
The regression formula has limitations to consider. It assumes linearity between variables, which may not always hold true in real-world scenarios where relationships can be nonlinear. The validity of the regression results relies on meeting the assumptions, and violations can lead to biased or unreliable estimates.
Recommended Articles
This article is a guide to what is Regression Formula. We explain it along with some examples, their various types and their uses.. You can learn more about Excel modeling from the following articles: –