What is Regression?
Regression analysis is a statistics-based measurement used in finance, investing, etc., aiming to establish a relationship between a dependent variable and other independent variables. The prime focus is determining the strength of the above relationship.
Key Takeaways
- Regression analysis is a statistical technique used in various fields, such as finance and investing, to establish a relationship between a dependent variable and one or more independent variables.
- The primary goal of regression analysis is to estimate the strength and nature of the relationship between the dependent and independent variables.
- The variables involved in regression analysis are categorized into two types: the dependent variable, which is the main variable of interest, and the independent variables, which are factors that potentially influence the dependent variable.
Explanations
- To explain regression analysis in lay terms, let us assume a sales head of a company is trying hard to forecast the following month’s sales. Numerous factors are involved which are driving the sales of the product, starting from the weather to the competitor’s new strategy, festival, and change in the lifestyle of consumers.
- It is a method of aligning out of the several factors which affect the sale, which are the ones that have the major impact. It can help answer many questions like what are the most important factors, what factors are less important, what is the relationship between them, and most importantly, what is the surety of these factors.
- These factors are called variables. The main factor we are trying to forecast is the dependent variable, and the other factors that impact the dependent variable are the independent variables.
Formula
Simple linear regression analysis in excel can be expressed as the formula below, measuring the relationship between a dependent variable and one independent variable.
Y = a + bX + ϵ
Here:
- Y – Dependent variable
- X – Independent (explanatory) variable
- a – Intercept
- b – Slope
- ϵ – Residual (error)
How to Interpret Regression Analysis?
One can interpret it by assuming a simple scenario. We are taking the relationship between the prices of an antique collection for auction and its age duration. The older an antique gets, the more the price it fetches. Assuming that we have set data for the last 50 items auctioned, we can predict the future auction prices based on the item’s age. Using this data, we can build a regression equation.
The regression formula which can set up a relation between age and price is as follows:
y = β0 + β1 x + error
- Here the dependent factor is Y. Y represents the price of each item to be auctioned, whereas the independent factor is X, which determines the age.
- Parameters β0 and β1 are parameters that are not known and will be estimated by the equation.
- β0 is a constant that defines the linear trend line and intercepts the Y-axis.
- β1 is a constant that demonstrates the magnitude of change in the value of the dependent variable as a related function of the change implied to the independent variables.
- It is called the slope of the equation. When the slope is linear, there is a proportional relationship between age and price, and where the slope is inverse, it means the relationship is indirectly proportional.
The error can be defined as the noise or variation in the target variable and is random.
Real-life Examples of Regression Analysis
Let us assume we need to establish a relationship between the sales and the amount spent on advertising related to a product.
We can generally observe a positive relationship between the sales quantity and the amount spent on advertising. Allying simple linear regression equation, we have got:
Y = a + bX
Suppose we get the value as
Y= 500 +30X
Result interpretation:
The predicted slope of 30 helps us conclude that the average sales increase by $30 per year as advertising spending increases.
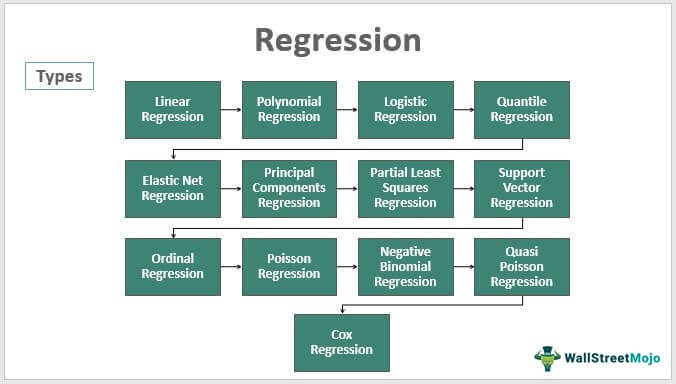
Types of Regression Analysis
#1 – Linear
One can express it as the formula below. It measures the relationship between a dependent variable and one independent variable.
#2 – Polynomial
This method uses the analysis to measure the relationship between single dependent factors and multiple independent variables.
#3 – Logistic
Here the dependent factor or variable is binary. The independent variables can be continuous or binary. We can afford to have more than two categories in multinomial logistic regression while choosing our independent variable.
#4 – Quantile
This is an additive concept of linear regression and one uses it primarily when outliers and skewness are present in the data.
#5 – Elastic Net
It is useful when one is handling very highly correlated independent variables.
#6 – Principal Components Regression (PCR)
It is a technique applicable when too many independent variables or multicollinearity exist in the data
#7 – Partial Least Squares (PLS)
It is the opposite of the principal component, where we have highly correlated independent variables. It is also applicable when there are many independent variables.
#8 – Support Vector
It can provide a solution to linear and non-linear models. It uses non-linear kernel functions to find the optimal solution for non-linear models.
#9 – Ordinal
It applies to the prediction of ranked values. It is suitable when the dependent variable is ordinal.
#10 – Poisson
This is applicable when the dependent variable has count data.
#11 – Negative Binomial
It is also applicable to manage count data only because negative binomial regression does not assume the count distribution has a variance equal to its mean. In contrast, Poisson regression assumes the variance equal to its mean.
#12 – Quasi Poisson
It is a substitute for negative binomial regression. It is also applicable to dispersed count data. The variance of a Quasi-Poisson model is a linear function of the mean, while the variance of a negative binomial model is a quadratic function of the mean.
#13 – Cox
It comes more into use for analyzing time-to-event data.
Difference Between Regression and Correlation
- Regression establishes the relationship between an independent variance and a dependent variable where both variables are different. In contrast, correlation determines the association or dependency of two variables where there is no difference.
- The main objective of regression is to create a line of best fit, and the estimation of one variable is done based on others. At the same time, correlation demonstrates the linear relationship between two variables.
- In this, we estimate the magnitude of a certain change in the recognized variable (X) on the estimated variable (Y). In correlation, the coefficient measures the extent to which the two variables move together.
- It is a process of estimating the magnitude of random independent variables based on the magnitude of a static dependent variable. In contrast, correlation helps us decide a particular value to express the interdependency between variables.
Conclusion
- Regression analysis primarily uses data to establish a relationship between two or more variables. It assumes that past relationships will also reflect in the present or future. However, few consider this a time lag between the past and present/future.
- However, it is a widely used forecasting and estimating technique. Although it involves mathematics, which many users may find tough, the technique is comparatively easy to use, especially when a model is available.
Frequently Asked Questions (FAQs)
Why regression analysis is important?
Regression analysis is important because it allows us to understand and quantify the relationship between variables. It helps in identifying the impact of independent variables on a dependent variable, allowing for prediction, hypothesis testing, and understanding of causal relationships. Regression analysis provides a systematic and statistical approach to model complex relationships, making it valuable in various fields such as economics, social sciences, finance, marketing, and healthcare.
What are the applications of regression analysis?
Regression analysis has a wide range of applications. It is commonly used in forecasting and prediction, such as predicting sales based on advertising expenditure or estimating future market trends. It helps in understanding the factors influencing a particular outcome, such as the impact of education and experience on salary.
What are the limitations of regression analysis?
Despite its usefulness, regression analysis has certain limitations. It assumes a linear relationship between variables, which may not always hold true. Nonlinear relationships may require alternative modeling techniques. Regression analysis relies on the availability of high-quality data, and if the data is unreliable or contains outliers, it can affect the accuracy of the results.
Recommended Articles
This article is a guide to What Regression Is and meaning. Here, we discuss the difference between regression analysis and correlation, along with types and examples. You can learn more about from the following articles: –