Table of Contents
What Is Hull Moving Average?
Hull Moving Average is a popular and advanced technical indicator used for trading in the financial markets. It is unique because of its ability to smoothen out price volatility, which is not possible using traditional methods.
It was created by Alan Hull in 2005, using a weighted moving average during calculation. The method is efficient in identifying entry and exit points by emphasizing more on current price data. This makes it easy to interpret it and use it for financial decisions.
Key Takeaways
- Hull Moving Average is an advanced technical indicator that is used for making financial and trading decisions in the market.
- It mainly uses current price data along with historical prices and weighted moving averages in the calculation.
- This helps eliminate any noise of volatility in prices and gives a smooth effect, facilitating the interpretation of prices through the reduction in lags.
- Traders get better confidence in making buy or sell decisions, which increases their scope to earn profits and reduce costs or risks.
Hull Moving Average Explained
Hull Moving Average is a technical indicator to analyze price trends using weighted moving averages. It was developed by Alan Hull in 2005, and it successfully eliminates any lags and inaccuracies due to price fluctuations.
Traders can identify entry and exit opportunities using hull moving average strategy much better than traditional moving averages because they use recent prices more than historical data. This controls short-term volatility and reduces trading risk and cost. Traders are able to make buy or sell decisions early. It is less susceptible to false signals.
The calculation involves complexity, but accuracy and reliability levels are higher than those of traditional methods. It calculates changes in trends and momentum quite early, providing better room to make investment decisions confidently.
Thus, this process of hull moving average strategy is able to retain the smoothness of the moving average while tracking the movement and changes in price levels. This makes it easy to understand the trend lines and the overbought and oversold positions of the financial instrument.
Formula
This process uses two separate weighted moving averages (WMA) for price. Then, another WMA will be used that will help smooth out the raw data. Therefore, the calculations involve three steps.
For the first step of WMA, the following formulas are used.
WMA 1 = WMA (n/2) of the prices
WMA 2 = WMA (n) of the prices.
In the above, the weighted moving average is calculated twice, once for the specified number of periods and another with half the specified number of periods. “n” denotes the number of periods in this case.
In the second step, the raw HMA is calculated, which is not smoothed out. For that, the formula is given below:
Raw HMA = 2 x (WMA 1) – (WMA 2)
In the final step, the final HMA figure is obtained, which smoothens out the raw HMA using another WMA. Here, a square root of “n” is taken. The formula is as follows:
HMA = WMA of raw HMA.
In case the result obtained is not a round figure, it is rounded off to the nearest decimal. This facilitates hull moving average calculation.
Interpretation
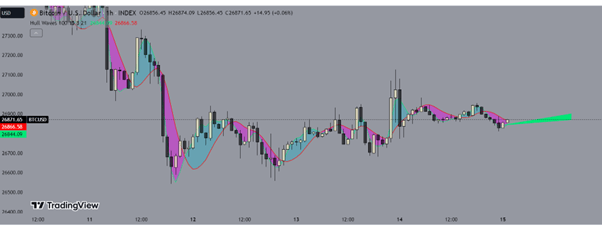
A chart from TradingView will help analyze the concept better. In the graph of Bitcoin given below, the Hull waves indicator has been used, which is calculated using Hull Moving Averages. As it is visible in the chart, there are a lot of price movements taking place for the financial instrument, but the moving average calculation provides the viewer with a smooth line that is easy to interpret. This is because it considers only the primary fluctuation levels without getting into the short-term ones that make the moving average complicated and less responsive.
Typically, the Hull Moving Average (HMA), taken for a 21-period, will be for the medium term, and it will give a more balanced view of the price trend, which will enable traders to identify reversal and continuation signals.
How To Use In Trading?
Since this process is very smooth and fast, giving more importance to recent data, it successfully eliminates lag in calculation. When the trader puts this indicator in the chart, they can see the moving average lines. In order to identify trends better, longer-period moving averages are more suitable. In such cases, if the HMA is rising, then it is a signal to enter the market and buy the asset since prices are showing a tendency to move up.
The opposite is the case if the HMA is going down. It indicates that the market or the financial instrument is showing a tendency of falling prices, which is again a signal to either sell off or go short on the asset. It should be noted that the entry signal for the long position is when the HMA is rising, and the entry for the short position is when the HMA is falling.
If the trader uses signals from hull moving average calculation for a short period, they may also be suitable for entry, but they should be taking in the direction of the trend, and it may be affected by price fluctuations. To summarise the trading strategy, the following points are essential:
- If the HMA crosses the support zone, it is an excellent time to buy since prices may go up. If it falls below the resistance, it is time to sell at falling prices.
- The hull moving average crossover or divergence method suggests that if the HMA moves away from the price action candlesticks. When the HMA diverges and moves above the price action, it is a bullish trend. A bearish trend occurs when the prices are moving up, but the HMA is falling.
- Since HMA filters out fluctuations, it is better to take a trade when it crosses a particular level.
Examples
Here are some examples to explain the concept.
Example #1
Jack is a long-term investor who wants to enter the market. He uses the HMA strategy to check the current trends and finds that even though the prices are showing a downward move in the chart, the HMA is diverging and moving up. Since this indicator reduces lags and smoothens out temporary fluctuations, his interpretation shows that the down moves are temporary and the primary price moves are following an uptrend. Thus, he enters a long position with the aim to earn profits when the market moves up.
Example #2
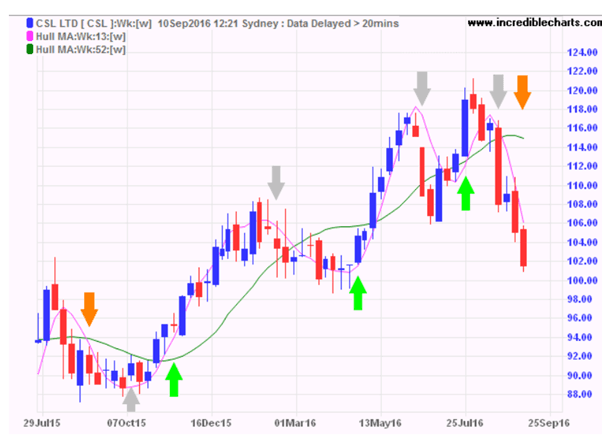
The concept of hull moving average indicator is easy to understand in detail by taking two different types of periods. If the trader compares a 13-week HMA to a 52-week HMA, they will have to select the parameters from the selection panel of the chart. Next, when both lines appear in the chart, the trader can trade accordingly. Since the 13-week signal is faster, the trader can decide to buy or sell from that. However, it is better to decide the direction of the trade using the 52-week HMA and take the trade when both move in the same direction. The concept of hull moving average crossover is stated in the figure below.
Advantages And Disadvantages
In spite of being widely used in the financial market, traders should consider both the advantages and disadvantages of the process before using it, as given below.
Advantages
- Hull moving average indicator is a versatile process and can be successfully used and applied across various financial instruments, like stocks, currency, cryptocurrencies, commodities, indices, etc. It can also be used in different timeframes, as per the goal of trading.
- Since it responds to price changes very fast, it helps traders make decisions much before the actual price movement, depending on reversals and trends.
- It smoothens out fluctuations and market noise, making interpretation easy.
Disadvantages
- It is necessary for the trader to understand the concept clearly so that they can select the proper parameters while using it, depending on their own investment goal and risk-taking ability.
- It is not totally free of false signals. Even though the accuracy level is excellent, it is not totally accurate.
- It should be used in combination with other indicators and not on a standalone basis because it will give more confident results.
- It also uses some historical data, even though current data is primary. This may result in some lags in the process.
