Part of our Time Series Analysis guide
What is Realized Volatility?
Realized volatility assesses variation in returns for an investment product by analyzing its historical returns within a defined period. Assessment of the degree of uncertainty and/or potential financial loss/gain from investing in a firm may be measured using variability/ volatility in the stock prices of the entity. In statistics, the most common measure is to determine variability in measuring the standard deviation, i.e., the variability of returns from the mean. It is an indicator of the actual price risk.
The realized volatility or actual volatility in the market is caused by two components: a continuous volatility component and a jump component, which influence the stock prices. Continuous volatility in a stock market is affected by intra-day trading volumes. For example, a single high-volume trade transaction can introduce a significant variation in the price of an instrument.
Analysts use high-frequency intraday data to determine volatility measures at hourly/daily/weekly, or monthly frequencies. One may then utilize the data to forecast the volatility in returns.
Key Takeaways
- Realized volatility is a measure of variation in returns for an investment product calculated by analyzing historical returns over a specific period.
- It helps determine the level of uncertainty and potential financial gain or loss associated with investing in a particular asset or firm.
- Standard deviation is a commonly used statistical tool to measure variability and assess the actual price risk in an investment. It provides insights into the volatility of an asset’s prices.
- Realized volatility in the market is influenced by two components: continuous volatility, which represents ongoing fluctuations in stock prices, and the jump component, which accounts for sudden and significant price movements.
Realized Volatility Formula
It measures calculating the standard deviation from the average price of an asset in a given period. Since volatility is non-linear, realized variance calculates first by converting returns from a stock/asset to logarithmic values and measuring the standard deviation of log normal returns.
The formula of realized volatility is the square root of realized variance.
Variance in daily returns of the underlying calculated as follows:
rt= log(Pt)- log (Pt-1)
- P= stock price
- t= time period
This approach assumes the mean to be set to zero, considering the upside and downside trend in the movement of stock prices.
Realized variance calculate by computing the aggregate of returns over the period defined:

Where N= number of observations (monthly/ weekly/ daily returns). Typically, calculates 20, 50, and 100-day returns.
Realized Volatility (RV) Formula = √ Realized Variance
Then, the results will annualized. Realized volatility annualized by multiplying the daily realized variance by the number of trading days/weeks/ months in a year. The square root of the annualized realized variance is the realized volatility.
Examples of Realized Volatility
Example #1
The supposed realized volatility for two stocks with similar closing prices is calculated for 20, 50, and 100 days for stock and is annualized with values as follows:
| Stock 1 | Stock 2 |
|---|---|
| RV100 = 25% | RV100 = 20% |
| RV50 = 35% | RV50 = 17% |
| RV20 = 50% | RV20 = 15% |
Looking at the pattern of increasing volatility in the given time frame, one can infer that stock-1 has been trading with high price variation in recent times (i.e., 20 days), whereas stock-2 has been trading without any wild swings.
Example #2
Let us calculate the realized volatility of the dow index for 20 days. Then, one can extract details of the daily stock prices in excel format from online sites such as Yahoo! Finance.
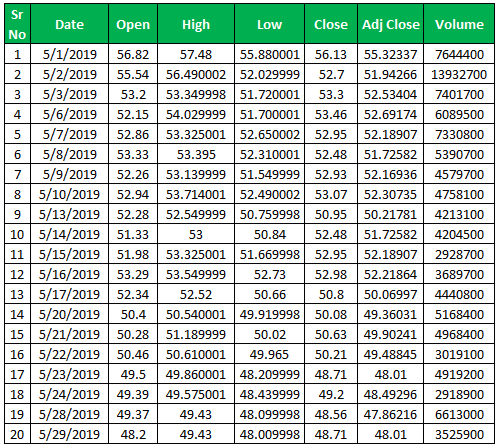
The fluctuation in stock prices is depicted in the chart below.
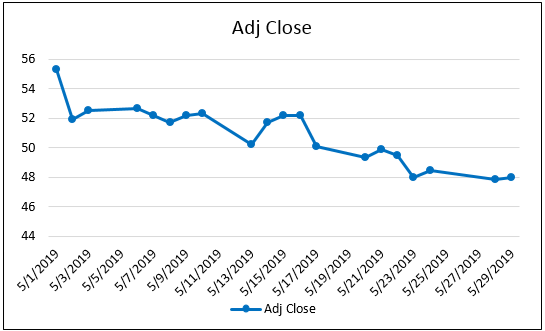
As may be observed, the stock price is declining with a maximum price deviation of USD 6.
One may calculate the deviation in daily returns as follows:

Variance in daily returns is the square of daily deviations.

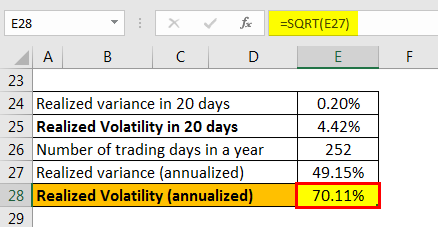
The calculated realized variance for 20 days is the aggregate return for 20 days. And the formula of realized volatility is the square root of realized variance.

The value is then annualized to make the result compared to other stocks.
Advantages
- It measures the actual asset performance in the past. It helps to understand the stability of the asset based on its past performance.
- It indicates how an asset’s price changed in the past and the period in which it has changed.
- Higher the volatility, the higher the price risk associated with the stock. Therefore, a higher premium is attached to the stock.
- One may use the realized volatility of the asset to forecast future volatility, i.e., implied volatility of the asset. While entering into transactions with complex financial products such as derivatives, options, etc., the premiums are determined based on the underlying volatility and influence the prices of these products.
- It is the starting point for option pricing.
- Realized volatility is measured based on statistical methods and is, therefore, a reliable indicator of the volatility in asset value.
Disadvantages
It is a measure of historical volatility and is therefore not forward-looking. It does not factor in any major “shocks” in the market that may arise in the future, affecting the underlying value.
Limitation
- The volume of data used influences the results when calculating realized volatility. At least 20 observations are statistically required to calculate a valid value of realized volatility. Therefore, realized volatility is better used to measure longer-term price risk in the market (~ 1 month or more).
- Realized volatility calculations are directionless. i.e., it factors in upward and downward trends in price movements.
- It assumes that asset prices reflect all available information while measuring volatility.
Important Points
- In order to calculate the downside risk associated with a stock, the realized volatility measurement may restrict downside price movements.
- An increase in realized volatility of a stock over time would imply a significant change in the stock’s inherent value owing to external/internal factors.
- An increase in volatility implies a higher premium on option prices. The value of a stock can be inferred by comparing the realized volatility and estimated future volatility (implied volatility) of the options.
- Comparing the volatility of a stock with the benchmark index helps determine the stability of the stock: the lower the volatility, the more predictable the asset’s price.
- A decrease in the realized volatility of a stock over a while would indicate the stabilization of the stock.
Realized volatility measures help to quantify the inherent price risk arising out of volume fluctuations and external factors of a stock based on its historical performance. Combined with implied volatility, it also helps determine option prices based on the volatility in the underlying stock.
Frequently Asked Questions (FAQs)
What is the difference between realized volatility and historical volatility?
Realized volatility refers to the actual volatility observed in the past based on historical data, while historical volatility is a broader term that encompasses both realized and implied volatility. Realized volatility is calculated using historical price data, while historical volatility can also include implied volatility derived from option prices.
What is the difference between GARCH and realized volatility?
GARCH (Generalized Autoregressive Conditional Heteroskedasticity) is a model used to estimate future volatility based on past volatility, while realized volatility is a measure of actual volatility observed in historical data. GARCH models consider the conditional variance of the data, whereas realized volatility focuses on the actual volatility observed over a specific period.
What are the applications of realized volatility?
Realized volatility finds applications in various fields, including finance and risk management. It is used in option pricing models, risk assessment, portfolio optimization, volatility forecasting, and trading strategies. Realized volatility provides insights into the actual level of price fluctuations, aiding in risk analysis, asset allocation decisions, and the assessment of derivative instruments. It also helps evaluate market efficiency and test financial theories related to volatility dynamics.
Recommended Articles
This article is a guide to What Realized Volatility is and its definition. Here, we discuss the formula to calculate realized volatility, along with examples and explanations. You can learn more from the following articles: –
- Formula of Population Variance
- Formula of Variance Analysis
- Correlation vs Covariance
- Variance vs Standard Deviation
Recommended Articles
Continue with these closely related articles from the same guide.