Table of Contents
Linear Regression Slope (LRS) Meaning
The Linear Regression Slope refers to a momentum oscillator trending in negative or positive territory. Analysts and traders utilize this technical analysis tool to gauge the current trend’s strength and direction. Individuals can use the insights provided by this indicator and make trading decisions to earn financial gains.
This tool shows the expected change in price on the basis of linear regression analysis utilizing the least squares method. If the slope values are positive and high, individuals can buy the asset or enter a long position. On the other hand, low and negative slope values act as a signal to enter a short position or sell for traders.
Key Takeaways
- Linear Regression Slope, meaning refers to a technical indicator that smooths a financial instrument’s price data utilizing the moving average of a particular duration and forming regression lines that end at every bar.
- It determines when the security is trending down or up and the intensity or strength of the price increase or decrease.
- One can use the LRS, the zero line, and support and resistance levels to develop and execute effective linear regression slope strategies.
- A noteworthy limitation of this tool is that it is a lagging indicator.
Linear Regression Slope Explained
This indicator measures the slope or the rate at which a linear regression line that is fitted to a financial instrument’s price data changes over a specific duration. It gives a numerical value, offering insight into an observed trend’s relative strength and general direction.
Individuals must develop an understanding of the two key components of this momentum oscillator to understand how the tool works. So, let us look at them in detail.
- Trend Strength: It is a quantitative measure indicating if the trend is moving in an upward or downward direction. The rapid movements of such an oscillator can help traders identify periods having strong trends.
- Trend Direction: This slope’s absolute value indicates the trend’s relative strength. While higher values typically indicate stronger trends, lower values that are close to the zero line generally indicate a consolidating or weaker trend. One can determine the strength of a trend by computing the difference between the slope and the mean value.
Formula
The linear regression slope formula is as follows:
LRS = {N x Σ(xy) – Σx x Σy)} ÷ {N x Σ(x^2) – (Σx)^2}
Where:
- ‘y’ represents the financial instrument’s closing prices
- ‘x’ shows the time intervals or periods.
- ‘N’ represents the number of periods or time intervals
How To Use The LRS In Trading? (Explain Using TradingView)
To use LRS in trading effectively, one must first develop a clear idea of the signals generated by it. The following pointers can help in that regard.
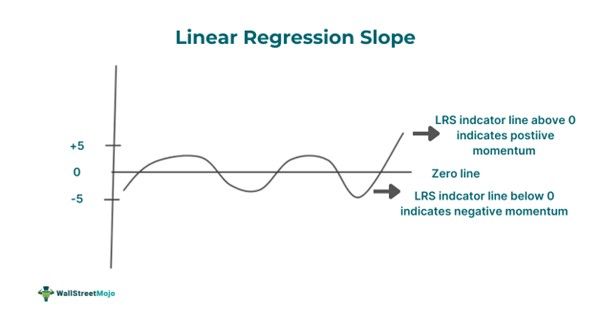
- The momentum is positive when LRS is above the zero line. On the other hand, the momentum is negative when the zero line is above LRS. This means one may consider buying the asset when the slope is above 0. In contrast, individuals can sell the asset when the slope is below 0.
- When the slope changes direction, this oscillator provides early signals of a likely trend reversal.
Let us look at the TradingView chart below to understand the signals better.
The line chart below the US Dollar / Canadian Dollar chart represents the linear regression slope indicator. The green portions above the zero line depict bullish momentum, while the red portions below the zero line show bearish momentum.
For instance, let us say that a trader waits for the slope to be positive and enters a long position when the value was 0.13 at 9 pm on 18 June 2021. The uptrend was strong then as represented by the green line. As a result, the trader could generate gains from the move.
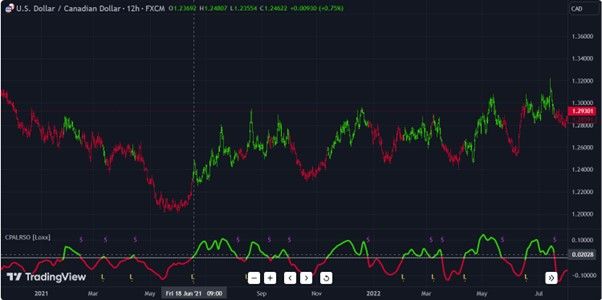
Source: TradingView
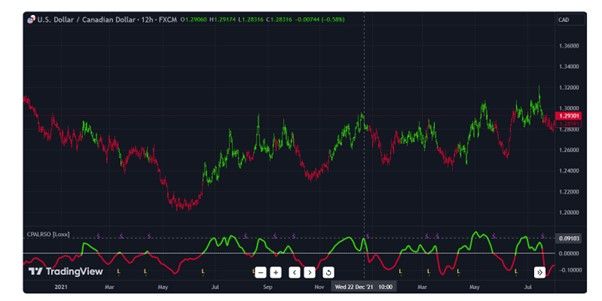
For example, on December 22, 2021, around 10 am, the slope changed direction. If someone entered a short position close to that point of change in direction, they could make substantial financial gains from the downtrend that followed.
Traders can use the linear regression slope with other indicators to ensure a comprehensive analysis and improve their trading strategy’s overall accuracy.
A popular linear regression slope strategy involves using the key support and resistance levels in the price chart. First, traders must wait for the price of the financial instrument to hit the resistance or support level. If the price hits the upper barrier of the slope, they can buy the asset. On the contrary, when the asset price reaches the lower barrier of LRS, traders can place a sell order.
Examples
Let us look at a few linear regression slope examples to understand the concept better.
Example #1
Suppose David is a trader who had Stock ABC on his watchlist for the past week. He used the linear regression slope indicator to identify positive and negative momentum. He found out that the stock was in a strong uptrend as the slope value was significantly above 1.
After some time, the indicator line changed its direction, and it started to fall sharply toward the zero line. He viewed this as a great opportunity to make a profit and decided to enter a short position. It turned out that his decision was correct as a strong downtrend materialized, and the slope value dropped significantly below 0. As a result, he made substantial financial gains by using the indicator.
Example #2
The following S&P Composite Index chart stretches back to 1871 on the basis of the inflation-adjusted or real monthly average of the daily closes.

Source: VettaFi
A semi-log scale has been utilized to equalize the vertical distances for an identical percentage increase or decrease, irrespective of the index’s price range. As one can observe, the above regression trendline visible through the price data shows the multi-year timeframes when the market trades below and above the trend. Incidentally, the linear regression slope depicts a 1.97% yearly growth rate.
Overall, from the above chart, it is clear that overperformance replaces underperformance while underperformance transforms into overperformance.
Advantages And Disadvantages
The benefits and limitations of this advanced momentum oscillator are as follows:
Advantages
- This momentum oscillator provides traders with a visual representation of the current trend’s direction and strength.
- LRS is versatile, and one can apply the indicator across different timeframes.
- Individuals can easily combine this oscillator with other indicators to ensure a detailed evaluation.
Disadvantages
- This technical analysis is a lagging indicator. Hence, it often cannot give timely signals in fast-moving markets.
- It cannot predict the future price movements of a financial instrument accurately every time. Hence, one must not solely rely on it for making trading decisions.
- This indicator is sensitive to the selection of the timeframe parameter, which impacts the trend analysis reliability.
