What Is Free Cash Flow to Equity (FCFE)?
Free Cash Flow to Equity (FCFE) is the total amount of cash available to be distributed to the investors; that is, the company’s equity shareholders, which is the amount the company has after all the investments, debts, and interests are paid off.
FCFE value is obtained when the capital expenditures, debt obligations, and other expenses or cash outflows are deducted from the total cash flowing in the business. It is used as a substitute to Dividend Discount Model, letting individuals and institutions calculate the fair value of the company stocks.
Key Takeaways
- Free Cash Flow to Equity (FCFE) represents the entirety of cash available to equity shareholders post-settlement of investments, debts, and interest obligations.
- FCFE computation encompasses net income as a starting point, integrating non-cash components like depreciation and amortization,
- Deducting capital expenditure related to expansion, incorporating shifts in working capital, and considering net borrowings, whether positive or negative.
- The FCFE model calculates a company’s equity value like the Dividend Discount Model.
- However, its applicability is constrained, primarily serving firms with stable leverage and falling short when applied to entities experiencing varying debt structures.
Free Cash Flow To Equity Explained
Free Cash Flow to Equity (FCFE) is one of the Discounted Cash Flow valuation approaches (along with FCFF) to calculate the Stock’s Fair Price. It measures how much “cash” a firm can return to its shareholders and is calculated after taking care of the taxes, capital expenditure, and debt cash flows.
In addition, Free Cash Flow to Equity model is very similar to the DDM (which directly calculates the Equity Value of the firm). Unfortunately, the FCFE model has various limitations, like the Dividend Discount Model. For example, it is useful only in cases where the company’s leverage is not volatile and cannot be applied to companies with changing debt leverage.

Free cash flow to equity is the valuation metric that helps investors be aware of the investment opportunities in a business. This is because it is derived after all the deductions that a firm needs to make to arrive at a figure that depicts its approximate profit figure over a period. This is what makes FCFE an important metric.
Though this is an important method of valuation for any business, it is recommended to companies to not depend on this solely to make any decision. It is always wise to evaluate and assess a business’s financial position by examining different factors using different methods. This, in turn, leads to wiser and smarter decision-making.
Video Explanation Of Free Cash Flow to Equity

Formula
The formula used to calculate free cash flow to equity varies based on the information available for the computation.

Image Source: Financial Modeling and Valuation Course Bundle
Let us see which formula is used when:
Free Cash Flow to Equity Formula starting with Net Income.
FCFE Formula = Net Income + Depreciation & Amortization + Changes in WC + Capex + Net Borrowings
| FCFE Formula | Additional Comments |
|---|---|
| Net Income |
|
| (+) Depreciation & Amortization |
|
| (+/-) Changes in Working Capital |
|
| (-) Capex |
|
| (+/-) Net Borrowings |
|
Free Cash Flow to Equity Formula Starting from EBIT
FCFE Formula = EBIT – Interest – Taxes + Depreciation & Amortization + Changes in WC + Capex + Net Borrowings
Free Cash Flow to Equity Formula Starting from FCFF
FCFE Formula = FCFF – [ Interest x (1-tax)] + Net Borrowings
Examples
Let us consider the following instances to understand the free cash flow to equity model properly:
Example 1
Now that we know the FCFE formula let us look at an example to calculate Free Cash Flow to Equity.
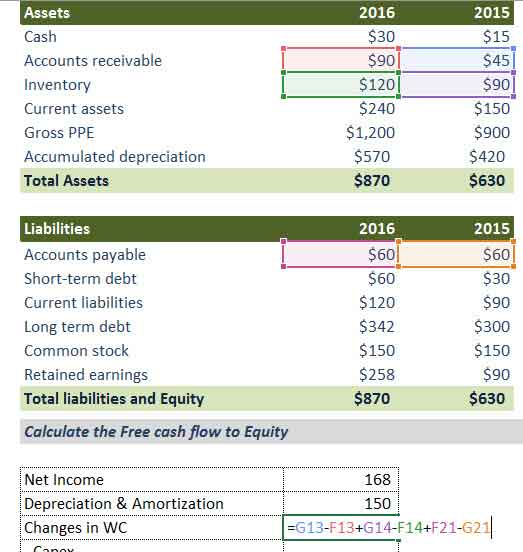
In this example below, you are provided with the Balance Sheet and Income Statement for 2015 and 2016. You may download the FCFE Excel Example from here.
Calculate Free Cash Flow to Equity for 2016

Solution –
Let us solve this problem using the Net Income FCFE Formula
FCFE Formula = Net Income + Depreciation & Amortization + Changes in WC + Capex + Net Borrowings
1) Find the Net Income
Net Income is provided in the example = $168
2) Find Depreciation & Amortization
Depreciation & Amortization is provided in the Income Statement. We need to add the 2016 Depreciation figure = $150
3) Changes in Working Capital
Below is the calculation for working capital.
- From the Current Assets, we take Accounts Receivables and Inventory.
- From Current Liabilities, we include the Accounts Payable.
- Please note that we do not take Cash and short-term debt in our calculations here.
4) Capital Expenditure
- Capital Expenditure = change in Gross Property Plant and Equipment (Gross PPE) = $1200 – $900 = $300.
- Please note that this is a Cash impact will be an outflow of 300
5) Net Borrowings
Borrowings will include both the short term and long term debt
- Short Term Debt = $60 – $30 = $30
- Long Term Debt = $342 – $300 = $42
- Total Net Borrowings = $30 + $42 = $72
Free Cash Flow to Equity for 2016 comes out to be as per below –

Example 2
On Nov 10, 2023, Wall Street conducted the two-stage free cash flow to equity method to figure out the fair value of the equity that industrial services firm SRG Global Limited held. The value estimated was AU$1.33. The step was taken to indicate the investment opportunities that the company has.
In the process, it was found that the shares of the company were undervalued to up to 49% and it was also revealed that the company peers traded the shares at a significantly lower rate.
How To Calculate?
A series of steps is followed to calculate free cash flow to equity accurately. This is to ensure reliability of the value obtained. Let us check the calculation steps involved below using Alibaba as an example:
Step 1 – Prepare financial model
The first step towards calculating FCFE is to assess various aspects of a business and prepare a fully integrated model that can be comprehended easily.
Step 2 – Find Projected FCFE
- Once you have prepared the financial model, you can prepare the template below for the FCFE calculation.
- In our case, we use the Net Income FCFE formula.
- Once you have all the line items projected using financial modeling, it is very simple to link (see below)

Step 3 – Find the present value of the detailed forecast Free Cash Flow to Equity.
- To find the value of Alibaba from 2015-to 2022, you need to find the present value of the projected FCFE.
- Please note that I have taken this as a random figure to demonstrate the Free Cash Flow to Equity methodology. For finding the present value, we assume that the Cost of Equity of Alibaba is 12%. To learn more about the Cost of Equity, please refer to the Cost of Equity CAPM.
- Here, you can use the NPV formula to calculate the NPV easily.

Step 4 – Find Terminal Value
- The terminal value here will capture the perpetuity value after 2022.
- The formula for Terminal value using Free Cash Flow to Equity is FCFF (2022) x (1+growth) / (Keg)
- The growth rate is the perpetuity growth of Free Cash Flow to Equity. We have assumed this growth rate to be 3% in our model.
- Once you calculate the Terminal Value, find the present value of the Terminal Value.

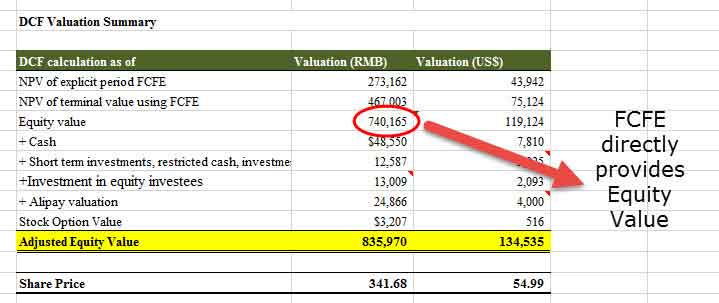
Step 5 – Find the Present Value
- Add the NPV of an explicit period and Terminal value to find the Equity Value.
- Please note that when we perform FCFF analysis, the addition of these two items provides us with an Enterprise value.
- We add Cash and other investments to the above Equity Value to find the Adjusted Equity Value.
- Divide the Adjusted Equity Value by a total number of shares outstanding to find the Share Price
- Also, note that my valuation using the FCFF approach ($191 billion) and FCFE approach ($134.5 billion) are coming out to be different primarily due to random assumptions of cost of equity (ke) and growth rates of FCFE.
Step 6 – Perform Sensitivity Analysis of Stock Prices.
You can also perform sensitivity analysis in excel of Stock prices on FCFE inputs – Cost of Equity and Growth Rates.

When To Use?
Free Cash Flow to Equity can be used under the following conditions –
1) Stable Leverage – As seen in this graph below, Starbucks and Kellogs have volatile Debt to Equity Ratio, , and hence, we cannot apply the FCFE valuation model to these companies. However, Coca-Cola and P&G have relatively stable Debt-Equity Ratios. We can apply the FCFE model to value the firm in such cases.
source: ycharts
2) Dividends are not available, or Dividends are very different from Free Cash Flow to Equity – In most high-growth companies like Facebook, Twitter, etc., do not give dividends. Hence, the Dividend Discount Model can’t be applied. You may apply the FCFE valuation model for such companies.
Negative FCFE
Free Cash Flow to Equity can have a negative value. Negative FCFE can happen due to any or a combination of the factors below –
- The company is reporting huge losses (Net Income is largely negative)
- The company makes huge Capex resulting in Negative FCFE
- Changes in working capital result in an outflow
- Debt is repaid, resulting in a large cash outflow
Below is an example where we find Negative FCFE. I had earlier evaluated Box IPO, and you can download its Box financial model here.
We note that in Box Inc, the main cause for Negative FCFE is Net Losses.

Free Cash Flow to Equity vs Dividends
FCFE can be taken as Potential Dividends instead of Actual Dividends.. Let us see how they differ from each other:
Dividends
- Each year, a part of the earnings may be paid to the shareholders (dividends payout), and the company retains the remaining amount for future growth.
- Dividends depend on the dividends payout ratio, and mature/stable companies try to follow a stable dividend policy.
Free Cash Flow to Equity
- The free cash is available after all the obligations have been taken care of (think of Capex, debt, working capital, etc.).
- FCFE starts with Net Income (before the dividends are deducted) and adds all the non-cash items like depreciation and amortization. After that, the Capital expenditure required for the company’s growth is subtracted. In addition, changes in working capital are also accounted for to run the business in the operating year successfully. Lastly, net borrowings (negative or positive) are added.
- Free Cash Flow to Equity is, therefore, “Potential Dividends” (leftover after all the stakeholders have been taken care of)
Free Cash Flow to Equity vs Free Cash Flow to Firm
FCFE and Free Cash Flow to Firm (FCFF) are two terms that play an important role in business valuation process. As they sound similar, many get confused and mistakenly use them as substitutes. Hence, it is expected from investors and firms to understand the difference between them clearly before evaluating businesses based on their respective values.
Listed below are the differences between free cash flow to equity valuation method and free cash flow to firm valuation method in brief:
- While FCFE is a levered cash flow, FCFF is an unlevered cash flow. This means that the former is the amount that is obtained after all financial obligations are deducted from the total money that a firm has, while the latter is the one that is yet to be adjusted to the financial obligations.
- In Discounted Cash Flow (DCF) valuation, FCFE computes the equity value of the company, which is also its intrinsic value. On the contrary, FCFF calculates the enterprise value.
Frequently Asked Questions (FAQs)
What is the importance of FCFE?
Free Cash Flow to Equity (FCFE) is crucial for investors and analysts to evaluate a company’s financial health and assess its attractiveness as an investment. It represents the cash flow available to a company’s equity shareholders after deducting expenses and obligations.
What are the benefits of FCFE?
The benefits of FCFE include its focus on equity holders, helping them understand the cash flows they might receive. It aids in valuation, enabling a more accurate determination of a company’s intrinsic value and potential returns. FCFE also helps assess a firm’s ability to pay dividends, repurchase shares, or invest in growth opportunities.
What is the difference between FCFF and FCFE?
The key difference between FCFF and FCFE lies in the recipients of the cash flows. FCFF considers all investors, including equity and debt holders, and represents the cash generated from operations available to all stakeholders. FCFE, on the other hand, focuses solely on equity shareholders and represents the cash available to them after satisfying all obligations.
Recommended Articles
This article has been a guide to what is Free Cash Flow To Equity. Here, we explain the concept with formula, how to calculate it, examples, and FCFF. You may also look at the related articles below for a better understanding of the topic.