What Is Terminal Value?
Terminal Value is the value of a business or a project beyond the explicit forecast period wherein its present value cannot be calculated. It includes the value of all cash flows, regardless of duration, and is an important component of the discounted cash flow model (DCF).
In DCF, the terminal value is the value of a company’s expected free cash flow beyond the period of an explicit projected financial model. You should pay special attention to assuming the growth rates (g), discount rates (WACC), and the multiples (PE ratio, Price to Book, PEG Ratio, EV/EBITDA, or EV/EBIT). It is also helpful to calculate the terminal value using the two methods (perpetuity growth method and exit multiple methods) and validate the assumptions used.
Terminal Value Explained
Useful Downloads – 1) Free Terminal Value Excel Templates (used in the post) and 2) Alibaba IPO TV Calculation Model
In the field of investment and financial analysis, the term terminal value refers to the value of a business that is estimated at some point of time in the future. The terminal value equation show how much value an investment will be generating beyond the period of cash flow projections.
Terminal value is a crucial requirement of the Discounted Cash Flow. Terminal Value is a fundamental concept in Discounted Cash Flows, accounting for more than 60%-80% of the firm’s total valuation. It is a very important concept in Discounted Cash Flows as it accounts for more than 60%-80% of the firm’s total valuation.
It isn’t easy to project the company’s financial statements showing how they would develop over a longer period.
The confidence level of financial statement projection diminishes exponentially for years, which is way farther from today. Also, macroeconomic conditions affecting the business and the country may change structurally.
Therefore, we simplify and use certain average assumptions to find the firm’s value beyond the forecast period (called “Terminal Value”) as provided by Financial Modeling.
The terminal value equation often accounts for a a huge part of the investment value. But there are many assumptions that are made in the process. The analysts often do a number or sensitivity analysis to compare the valuation with the assumptions. It is also be be kept in mind that the choice of method will depend on the type of investment.
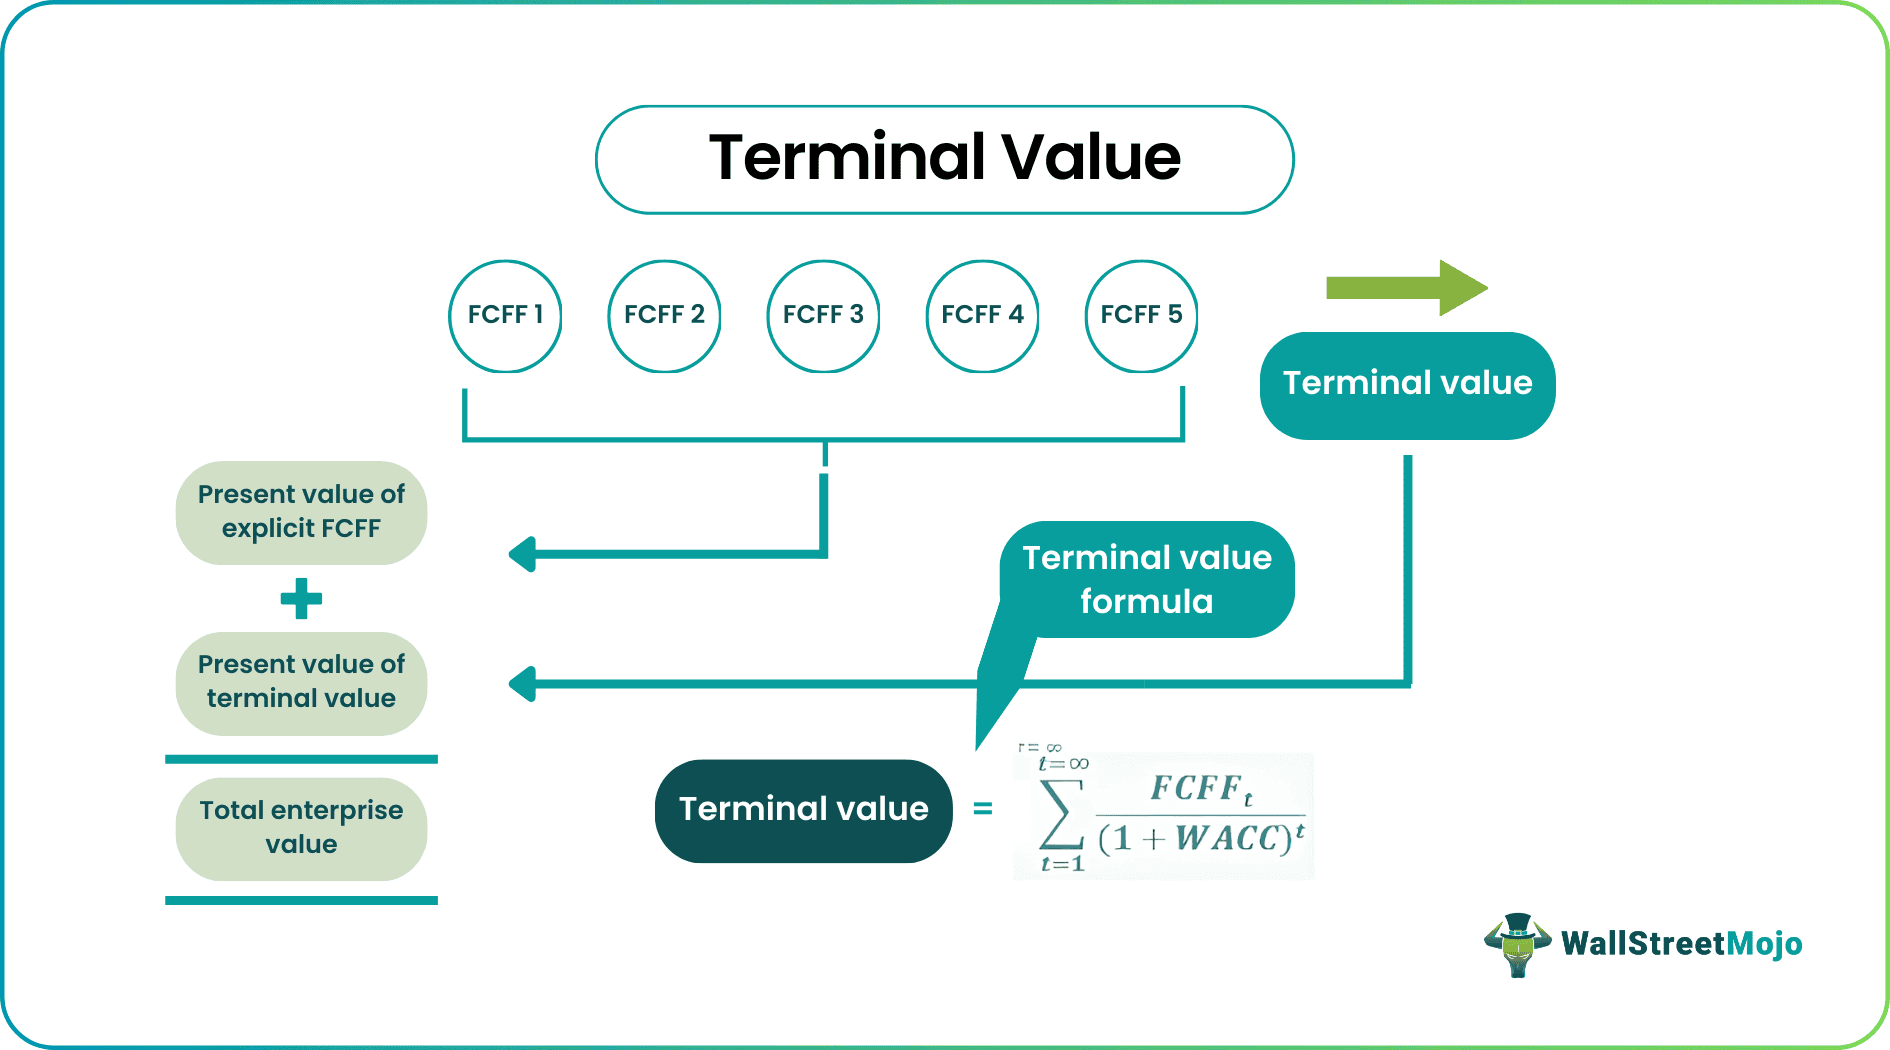
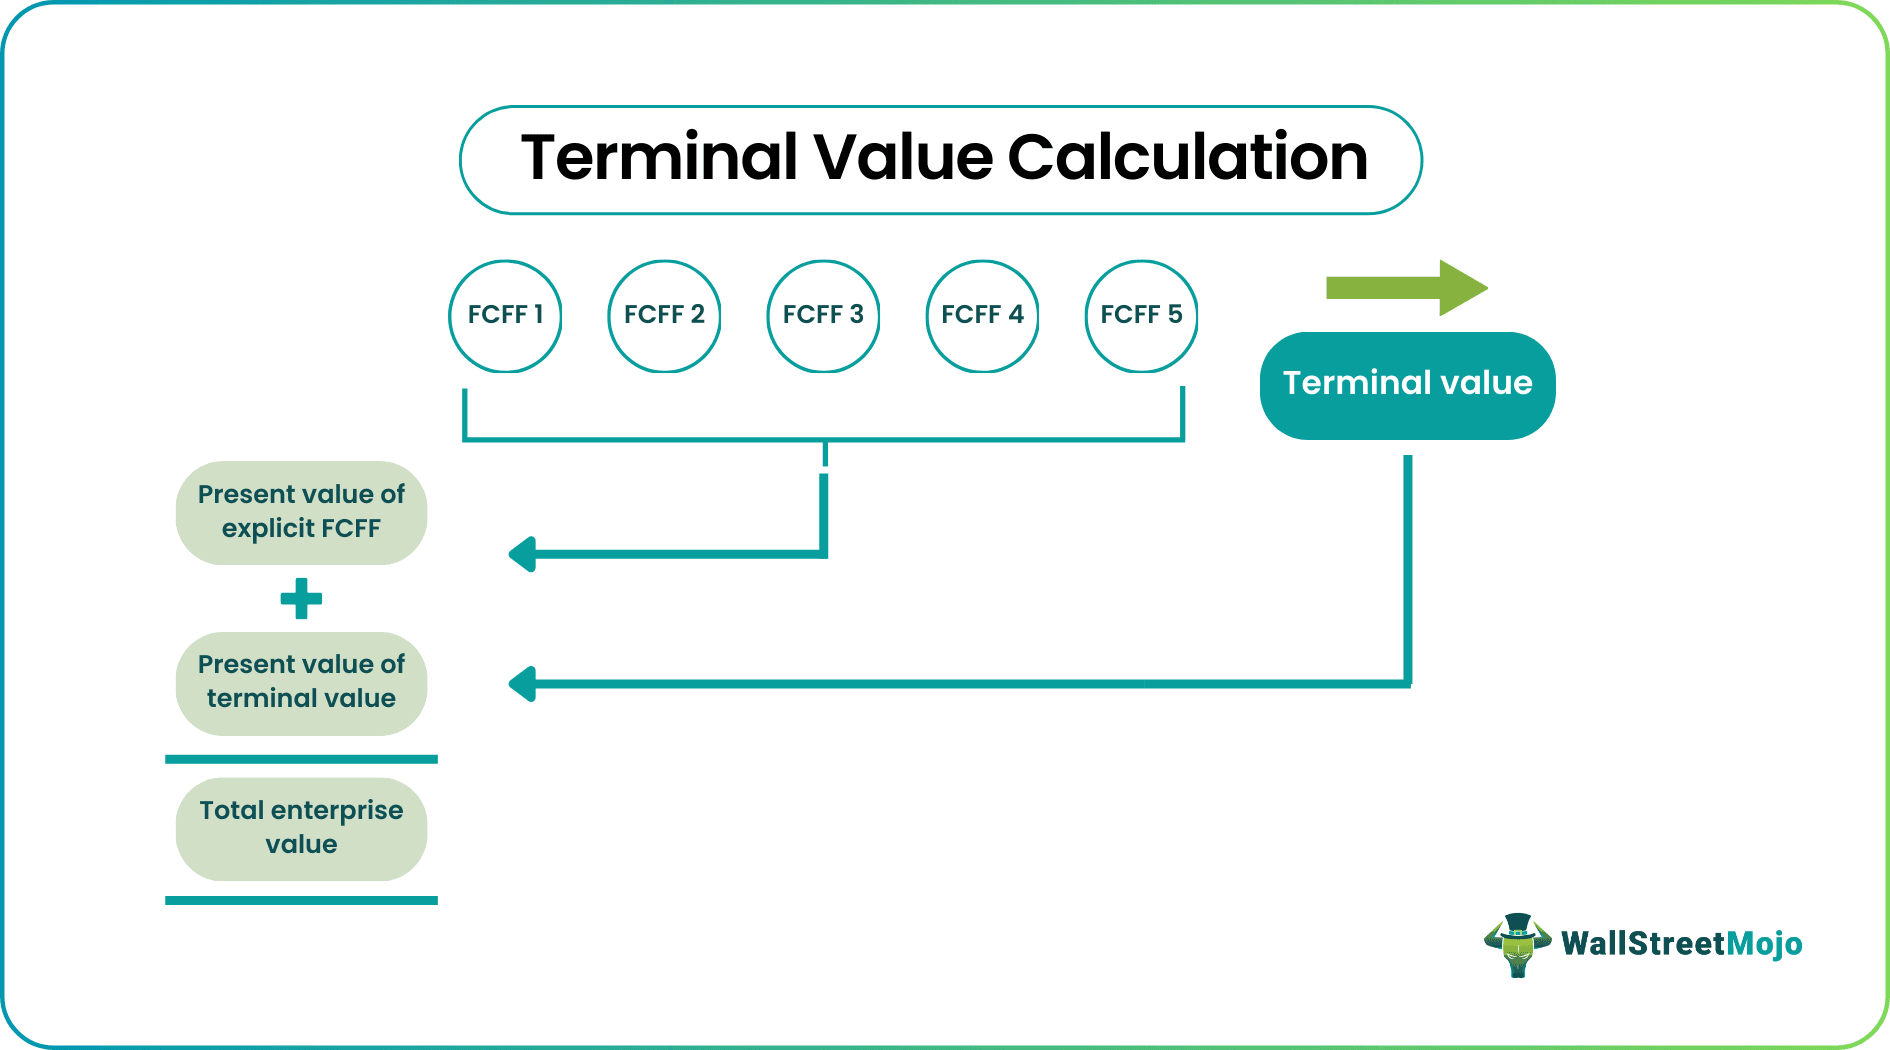
The following graph shows why we calculate Terminal Value in DCF.
Terminal Value – Explained in Video

Assumptions
In the process, a few assumptions are made to calculate the future value of an investment or business beyond a point of time, which have a significant impact on the valuation outcome. Let us study them in details.
- Growth rate – The most important assumption is the growth rate that the investment is expected to acquire on a continuous basis. This is assumed based on the historical data or any other industry benchmark. In the Gordon Growth model, the growth is assumed to be constant.
- Stability – The concept also assumes that the business or investment is operating used stable conditions that are predictable on a long term basis. This signifies that any fluctuations of changes will not be accounted for.
- Competitive advantage – It is assumed that the business will continue to sustain its position in the market on a continuous basis, and sustain its growth and expansion.
- Reasonable capital expenditure – The terminal value formula assumes that the business will make a reasonable amount of capital expenditure that will not affect its operations in a negative way and the business will operate effectively.
- Discount rate – This will have to be selected very carefully. It is the rate of return that is expected from the investment. The concept assumes a consistent discount rate and risk profile.
- Industry regulation – This fact is assumed taking into account the current conditions and historical trends. The industrial growth and regulatory environment in which the company operates will affect the terminal value to a great extent.
Thus, the above assumptions are considered while utilizing the concept of terminal value of a company. The reliability of the value estimation depends on the accuracy level of the assumptions mentioned above.
How To Calculate?
There are three ways to calculate the Terminal Value of the Firm. The first two approaches assume that the company will exist on a going concern basis at the time of estimation of TV. The third approach terminal value formula assumes the company is taken over by a larger corporation, thereby paying the acquisition price. Let us look at these approaches in detail.
#1 – Perpetuity Growth Model
Please remember that the assumption here is that of “going concerned.”
This method is the preferred formula to calculate the firm’s firm’s Terminal Value. This method assumes that the company’s growth will continue (stable growth rate), and the return on capital will be more than the cost of capital. We discount the Free cash flow to the firm beyond the projected years and find the Terminal Value.
Using cool maths, we can simplify the formula as per below –
Terminal Value Calculation = FCFF6 / (WACC – Growth Rate)
Numerator of the above formula can also be written as FCFF (6) = FCFF (5) x (1+ growth rate)
The revised calculation of terminal value is as follows –
Terminal Value = FCFF5 * (1+ Growth Rate) / (WACC – Growth Rate)
A reasonable estimate of the stable growth rate here is the GDP growth rate of the country. Gordon Growth Method can be applied in mature companies, and the growth rate is relatively stable. An example could be mature companies in the automobile sector, the consumer goods sector, etc.
#2 – No Growth Perpetuity Model
This formula assumes that the growth rate is zero! This assumption implies that the return on new investments is equal to the cost of capital.
Non-growth perpetuity terminal value calculation.
Terminal Value = FCFF6 / WACC
This methodology may be useful in sectors where competition is high, and the opportunity to earn excess returns tends to move to zero.
#3 – Exit Multiple Method
This formula uses the underlying assumption that a market with multiple bases is a fair approach to value a Business. A value is typically determined as a multiple of EBIT or EBITDA. For cyclical businesses, instead of the EBITDA or EBIT amount at the end of year n, we use an average EBIT or EBITDA throughout a cycle. For example, if the metals and mining sector is trading at eight times the EV/EBITDA multiple, then the company’s TV implied using this method would be 8 x the EBITDA of the company.
Example
Let us understand the concept of terminal value of a company with the help of some suitable examples.
Example#1
In this example, we calculate the fair value of the stock using the two-terminal value calculation approaches discussed above. 
In addition to the above information, you have the following information –
- Debt = $100
- Cash = $50
- Number of shares = 100
Find the per share fair value of the stock using the two proposed terminal value calculation methods.
Share Price Calculation – using the Perpetuity Growth Method
Step 1 – Calculate the NPV of the Free Cash Flow to the firm for the explicit forecast period (2014-2018)
Step 2 – Calculate the Terminal Value of the Stock (at the end of 2018) using the Perpetuity Growth method.
Step 3 – Calculate the Present Value of the TV
Step 4 – Calculate the Enterprise Value and the Share Price
Please note that the Terminal value contribution towards Enterprise value is 78% in this example! This is no exception. Generally, you will note that it contributes to 60-80% of the total value.
Share Price Calculation – using the Exit Multiple Method
Step 1 – Calculate the NPV of the Free Cash Flow to the firm for the explicit forecast period (2014-2018). Please refer to the above method, where we have already completed this step.
Step 2 – Calculate the Terminal Value of the Stock (at the end of 2018) using the Exit Multiple Method. Let us assume that the average companies are trading at a 7x EV/EBITDA multiple in this industry. Then, we can apply this very same multiple to find the TV in this stock.
Step 3 – Calculate the Present Value of the TV
Step 4 – Calculate the Enterprise Value and the Share Price
Please note that TV contribution towards Enterprise value is 77% in this example!
With both methods, we are getting share prices that are very close to each other. Sometimes, you may note large variations in the share prices, and in that case, you need to validate your assumptions to investigate such a large difference in share prices using the two methodologies.
Example#2
You may download Alibaba’s Financial Model from here. The below diagram details the free cash flow of the firm of Alibaba and the approach to finding a fair valuation of the firm.
Valuation of Alibaba = Present Value of FCFF (2015-2022) + Present Value of FCFF (2023 until infinite “TV”)
Step 1 – Calculate the NPV of the Free Cash flow to the firm Alibaba for the explicit period (2015-2022)
Step 2 – Calculate the Terminal value of Alibaba at the end of the year 2022 – In this DCF model, we have used the Perpetuity Growth method to calculate the Terminal Value of Alibaba.
Step 3. Calculate the Calculate the Net Present Value of the TV.
Step 4 – Calculate the Enterprise Value and Fair Share Price of Alibaba
Please note that TV contributes approximately 72% of the total Enterprise Value in the case of Alibaba.
Can You Get Negative Terminal Value?
Theoretically, YES, Practically NO!
Theoretically, this can happen when the Terminal value is calculated using the perpetuity growth method.
Terminal Value = FCFF5 * (1+ Growth Rate) / (WACC – Growth Rate)
In the above calculation, if we assume WACC < growth rate, then the value derived from the formula will be Negative. This is very difficult to digest as a high-growth company is now showing a negative terminal value because of the formula used. However, this high growth rate assumption is incorrect. We cannot assume that a company will grow at a very high rate until it is infinite. If this is the case, this company will attract all the capital available in the world. Eventually, the company would become the entire economy, and everyone working for this company (Awesome! unfortunately, this is unlikely!)
When doing valuation, a negative terminal value practically doesn’t exist. However, if the company is in huge losses and goes bankrupt in the future, the equity value will become zero. Another cause could be if the company’s product is becoming obsolete, like the typewriters or pagers, or Blackberry(?). So you may also land up in a situation where equity value may become closer to zero.
Limitations
Give below are some important limitations of the concept of terminal value of a stock. Let us study them in details.
- Please note that if we use the exit multiple methods, we are mixing the Discounted Cash Flow approach with the Relative Valuation Approach as the exit multiples have arrived from the comparable firms.
- It typically contributes more than 75% of the total value. This becomes a bit risky if you consider that this value varies a lot with even a 1% change in WACC or Growth Rates.
- Companies like Box can demonstrate negative Free Cash Flow to the firm. In this case, none of the three approaches will work. This implies that you cannot apply a Discounted Cash Flow approach. The only way to value such a firm will be to use Relative valuation multiples.
- The growth rate cannot be greater than WACC. If such is the case, you cannot apply the Perpetuity Growth Method to calculate Terminal Value.
Terminal Value Vs Instrumental Value
Both the above are two different concepts frequently used in the field of ethics and finance.
- The former is used in the field on finance and investment for the purpose of analysis and valuation of business and investment. But the latter is associated with philosophy, ethics, or study of values.
- The former represents the value of an asset at a point of time in the future. But the latter represents something that is desirable or has a lot of value because it helps in achieving a goal.
- The former is calculated based on the expected cash flow’s future value whereas this is not the case with the latter.
Thus the above are some basic differences between the two concepts.
What’s Next?
If you learned something new or enjoyed the post, please comment below. Let me know what you think. Many thanks, and take care. Happy Learning!
Recommended Articles
The article has been a guide to what is Terminal Value. We explain how to calculate, examples, differences with instrumental value & if it can be negative.