Part of our Bond Pricing & Yield Curves guide
What is a Normal Yield Curve?
A normal Yield Curve or Positive Yield Curve arises when longer maturity debt instruments offer higher yield as compared to shorter maturity debt instruments carrying similar credit risks and credit quality. The yield curve is positive (upward sloping) because investors demand more money for locking up their money for a higher period.
Key Takeaways
- The normal yield curve emerges when longer-term debt offers higher yields than shorter-term debt with comparable credit risks.
- This happens because investors demand more compensation for locking in their money for extended periods. Consequently, the yield curve slopes upward, reflecting this trend.
- The normal yield curve has implications for the present and future strength of the economy. It provides insights into the potential direction of the economy in the future, offering early indications of economic shifts.
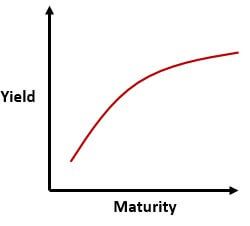
Graphical Presentation of Normal Yield Curve
The yield curve is created below on a graph by plotting yield on the vertical axis and time to maturity on the horizontal axis. When the curve is normal, the highest point is on the right.
Different Theories of Interest Rates

#1 – Expectation Theory
Expectation theory says that long-term interest rates should reflect expected future short-term rates. It argues that forward interest rates corresponding to certain future periods must be equal to future zero interest rates of that period.
If the 1-year rate today is at 1%, and the 2-year rate is 2%, then the one-year rate after one year (1yr forward rate) is around 3% [1.02^2/1.01^1].
#2 – Market Segmentation Theory
There is no relationship between short-term, medium-term, and long-term interest rates. The interest rate at a particular segment is determined by demand and supply in the bond market of that segment. Under the theory, a major investment such as a large pension fund invests in a bond of a certain maturity and does not readily switch from one maturity to another.
#3 – Liquidity Preference Theory
Investor prefers to preserve liquidity and invest funds for a short period. On the other hand, Borrowers prefer to borrow at fixed rates for long periods of time. This leads to a situation where the forward rate is greater than the expected future zero rates. This theory is consistent with the empirical result that the yield curve tends to be more upward-sloping than downward-sloping.
Changes or Shifts in Normal Yield Curve
- Parallel Shifts – Parallel shift in the yield curve occurs if the yields across all the maturity horizons change (increase or decrease) by the same magnitude and similar direction. It represents when a general level of interest rate changes in an economy.
- Non Parallel Shifts – When the yield across different maturity horizons changes at a different level in both magnitude and direction.
Importance
- The yield curve’s shape indicates the interest rate’s future direction. It forecasts the future direction of the interest rates: a normal curve means longer-term securities have a higher yield, and an inverted curve means short-term securities have a higher yield.
- Banks and financial institutionsfinancial institutions accept deposits from customers and provide loans to corporate or retail clients in exchange for a return. The wider the difference between lending and borrowing rates, the more spread. The steeper upward sloping curve will provide higher profits. In contrast, the downward sloping curve will lead to lower profits if the major portion of bank assets are in the form of long-term loans after considering short-term customer deposits.
- A trade-off between maturity and yield- long-term bonds tend to be more volatile than short-term bonds and hence offer a greater premium to an investor in the form of higher yield to encourage them to lend.
- It indicates to investors whether the security is overpriced or underpriced based on its theoretical value. If the return is above the yield curve, security is said to be underpriced, and if the return is below the yield curve, security is overpriced.
Influence
- Central banks target economic growth and inflation rate through changing interest rate levels. To respond to a rise in inflation, central banks increase interest rate levels wherein borrowing becomes expensive and erodes the purchasing power of consumers, which further leads to an inverted yield curve.
- Economic growth: strong economic growth provides the varying opportunity for investment and expansion in business, which leads to an increase in aggregate demand for capital; given a limited supply of capital, the yield curve increases, which results in the steeping of the yield curve.
Key Points to Remember
- It is an upward-sloping normal curve from left to right, indicating that yield increases with maturity. It is often observed when the economy grows at a normal pace without any major interruptions of available credit; e.g., 30-year bonds offer higher interest rates than 10-year bonds.
- An investor investing in longer maturity bonds requires higher compensation for taking additional risks as there is a greater probability of unexpected negative events in the long term. In other words, the longer the maturity, the longer time it will take to get back the principal amount. The greater the risks involved, the higher the expected yield, which will lead to the upward sloping yield curve.·
- The shape of the yield curve determines the current and future strength of the economy. It provides early warning signals on the future direction of the economy. It always changes based on shifts in the general market conditions.
- Every bond portfolio has different exposures to how the yield curve shifts — i.e., yield curve risk. The predicted percentage change in the price of a bond that occurs when yields change by one basis point is captured by an advanced concept called “duration.”·
- Duration measures the linear relationship between yield and bond price. It is a simple measure for small changes in yield, whereas convexity measures the non-linear relationship and is more accurate for large changes in yields.
Frequently Asked Questions (FAQs)
Is the normal yield curve concave or convex?
The normal yield curve is typically upward-sloping and convex. This means that as the maturity of bonds increases, their yields also increase. It reflects the expectation of higher interest rates in the future, compensating investors for the extended period they hold bonds.
What are the applications of a normal yield curve?
The normal yield curve has several applications:
Economic Outlook: An upward-sloping curve suggests a growing economy with rising interest rates.
Investment Strategy: Investors may choose longer-term bonds for higher yields.
Borrowing and Lending: Firms might borrow short-term and long-term to benefit from the yield spread.
Policy Decisions: Central banks monitor yield curves to assess economic conditions and guide monetary policy.
What is a normal vs. inverted yield curve?
A normal yield curve has an upward slope, indicating higher yields for longer-term bonds. This is typical in healthy economies. An inverted yield curve, on the other hand, slopes downward, with shorter-term yields higher than longer-term yields. It often indicates economic uncertainty and can signal an impending recession. Economists, investors, and policymakers closely watch the relationship between short- and long-term yields for insights into the economy’s health.
Recommended Articles
This has been a guide to what is a normal yield curve. Here we discuss different theories of interest rate, changes, or shifts in the normal yield curve, its influence, and its importance with a detailed explanation. You can learn more about fixed income from the following articles –
Recommended Articles
Continue with these closely related articles from the same guide.