What is a LIBOR Curve?
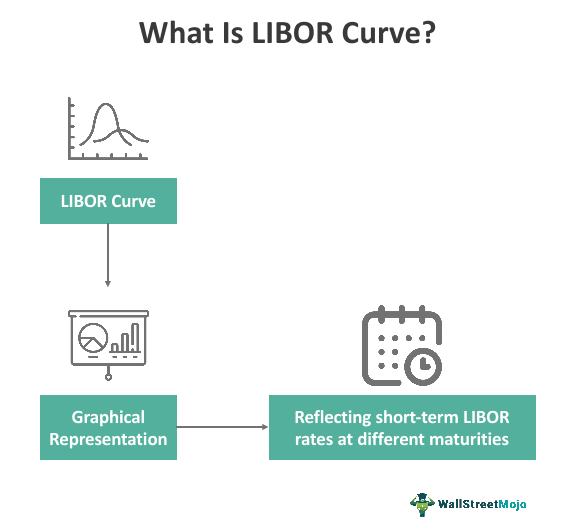
The LIBOR curve represents the values of the LIBOR rate graphically at various maturity intervals, such as one-month rate, two-month rate, etc., and various banks and other financial institutions use it to determine the interest rate for debt-based and other financial products. A graphical representation makes it easier to analyze and make decisions.
The LIBOR curve data is a fundamental financial benchmark that plays a pivotal role in global financial markets, particularly in the realm of interest rates. It represents the interest rates at which major banks can borrow funds from one another in the London interbank market. The LIBOR curve provides a graphical representation of the relationship between these interest rates and the time to maturity.
Key Takeaways
- The LIBOR curve visually represents the LIBOR rate at different maturity intervals, like one-month or two-month rates. Many banks and financial institutions use it to calculate interest rates for their debt-based and other financial products.
- Banks and rating agencies use LIBOR as a benchmark rate to determine interest rates for short-term borrowing. This rate is used for different types of debt and derivatives.
- LIBOR rate is used in interest rate futures contracts to establish settlement prices and provides helpful information on projected interest rates.
LIBOR Curve Explained
The LIBOR curve graphically represents the LIBOR rate for various maturities. The rate is being used globally by the leading banks and other financial products and continues to be used to date.
It serves as a reference point for setting interest rates on a wide range of financial products, including loans, mortgages, and derivatives. The curve reflects the cost of borrowing money, impacting everything from consumer loans to corporate debt.
Changes in the shape and steepness of the curve can signal economic health or instability. A steep curve, where long-term rates are significantly higher than short-term rates, may indicate market expectations of economic growth. A flat or inverted curve, on the other hand, can signal potential economic downturns.
Financial institutions use this metric as a basis for pricing financial products. It helps in valuing fixed-income securities, structuring interest rate swaps, and hedging against interest rate risk.
The LIBOR curve graph reflects market expectations regarding future interest rates, providing insights into investor sentiment. Central banks often consider these expectations when setting their monetary policies.
It’s important to note that this curve underwent significant changes due to the discontinuation of LIBOR in favor of alternative reference rates such as SOFR (Secured Overnight Financing Rate). As a result, financial markets have transitioned to these new benchmarks. Nonetheless, the concept of the LIBOR curve remains vital in understanding interest rate dynamics and its historical significance in the financial world.
Examples
Now that we understand the basics of LIBOR curve data, let us apply the theoretical knowledge to practical application through the examples below.
Example #1
Let us have a look at an example of a one-year LIBOR Curve for the year 2019.

The curve is based on the following data.
| Month | Rate |
|---|---|
| Dec | 1.96% |
| Nov | 1.93% |
| Oct | 2.04% |
| Sep | 1.95% |
| Aug | 2.24% |
| Jul | 2.20% |
| Jun | 2.41% |
| May | 2.71% |
| Apr | 2.73% |
| Mar | 2.88% |
| Feb | 2.96% |
| Jan | 3.00% |
The curve here represents the movement in the LIBOR interest rate every month. The rates for twelve months are depicted in the graph. The LIBOR rate for all twelve months can be determined by looking at the graph.
Example #2
The central bank of the Philippines, The Bangko Sentral ng Pilipinas or BSP, announced in June 2023 that they are moving away from LIBOR to a 28-day bill rate.
They chose the 28-day securities bill as it is a heavily-populated tenor. They also mentioned that since macro financial decisions are made based on this metric, it is for everyone’s benefit that the benchmark is more credible and efficient, citing that the LIBOR curve had its flaws that cannot be overlooked.
Uses
Let us understand the uses of LIBOR curve graph through the discussion below.
- LIBOR curve is the benchmark rate on a global level used by leading banks, financial institutions, and credit rating agencies for determining the interest rate for short-term borrowings. Financial institutions are using the rate for determining the interest rate for various debt products such as corporate loans, bonds, credit cards, security-based loans, etc. Also, the LIBOR rate is not limited to debt-based products since the same is also used for other products, such as derivatives.
- It is important to note that the LIBOR rate represents the lowest rate of lending, and the interest rate is represented above this rate. For example, when it is quoted that the rate of interest is “LIBOR + X basis points,” then it means the financial institution is charging x% of the premium above the LIBOR rate to its borrower. Whenever the LIBOR base rate changes, the lending rate will also fluctuate. This is why the LIBOR rate is a floating interest rate.
- Further, the LIBOR rate is also helpful in interest rate futures contracts for setting up the settlement price, which helps the party to the contract protect itself from the interest rate fluctuations. Also, other beneficiaries have an idea of expected interest rates based on the LIBOR rate.
Importance
The LIBOR curve data is an important tool for banks and financial institutions based on the globally determined benchmark rate. The same is useful for determining the interest rates for lending and other financial products such as interest rate swaps and LIBOR futures. A majority of global financial products are based on LIBOR. The regulatory authorities also use the rate to suggest the maximum spread at which loans can be given to borrowers abroad.
LIBOR Curve vs. Swap Curve
Let us understand the differences between LIBOR curve data and swap curve through the comparison below.
- The LIBOR curve represents the maturities of the LIBOR rate over a graph, and its maturities are for intervals of less than a year. The rate is based on the five major currencies. Namely, US Dollar, British Pound, Euro, Japanese Yen, and Swiss Franc, and the rate is represented for a total of seven maturities: spot, one week, one month, two months, three months, six months, and twelve months. LIBOR rates are being calculated, and the result is published every day by an organization named ICE (Intercontinental Exchange).
- On the other hand, the Swap curve represents the swap rates at different levels of maturities. The swap curve indicates the expected rates of return for various maturity periods. The swap curve is used mainly in the financial markets and by investors. It represents the interest rates expected by the participants of the market. The rate is based on market expectations and the risks the participants incur.
Frequently Asked Questions (FAQs)
How is LIBOR curve construction?
Typically, the curve is split into three sections. LIBOR rates establish the short end, the middle is formed by Eurodollar futures or forward rate agreements (FRA), and mid-swap rates determine the far end.
What is the three-month LIBOR curve?
The 3-month USD LIBOR forward curve indicates what the market expects for future USD LIBOR rates. It is determined by analyzing trade data from Eurodollar Futures and LIBOR swap rates. The angle also considers the future expectations of the Federal Open Market Committee (FOMC) policy.
What will replace the LIBOR curve?
In the United States, SOFR is the main alternative to LIBOR. This benchmark is determined by the interest rates that American financial institutions charge each other for overnight loans. These loans are typically in the form of Treasury bond repurchase agreements or repos agreements.
What does the shape of the LIBOR curve indicate?
The shape of the LIBOR curve can indicate market expectations about future interest rates and economic conditions. A standard or upward-sloping curve suggests that markets expect interest rates to rise over time. An inverted or downward-sloping curve might offer expectations of lower interest rates in the future.
Recommended Articles
This has been a guide to what is a LIBOR Curve. Here we explain its examples, uses, importance, and compare it with the swap curve in detail. You may learn more about Financing from the following articles –