Part of our Bond Pricing & Yield Curves guide
What Is Bootstrapping Yield Curve?
Bootstrapping is a method to construct a zero-coupon yield curve. The following bootstrapping examples provide an overview of how a yield curve is constructed. Although not every variation can be explained as there are many methods in bootstrapping because of differences in conventions used.
The bootstrap examples give an insight into how zero rates are calculated for the pricing of bonds and other financial products. One must correctly look at the market conventions for proper calculation of the zero rates. However, using this method one can get a set of interest rates at different maturities even though the price are available for only some points.
Key Takeaways
- Bootstrapping constructs a yield curve by using prices of coupon-bearing and zero-coupon bonds, estimating yields for various maturities.
- Bootstrapping solves equations to determine yields, deriving implied yields for zero-coupon bonds of different maturities, starting with market prices of coupon bonds.
- Bootstrapping facilitates interpolation and extrapolation of yields between known maturities.
- By utilizing the derived yields from the coupon bonds, the yield curve can be extended to include yields for intermediate maturities
- or even longer tenors beyond the available bond market, providing a comprehensive view of the yield curve’s shape and trends.
Bootstrapping Yield Curve Explained
The bootstrapping yield curve refers to the technique used in the financial market in which an yield curve is derived from a set of interest rates and or the yields of financial products having coupons, like the bonds or the bootstrapping yield curve from swap rates. It shows the relationship between the time at which the debt instruments mature and their interest rates.
This yield curve can be constructed by using certain steps. First it is necessary to collect yields or the market prices of a set of various debt instruments which has different maturities. Such financial instruments can be corporate or government bonds, or any other fixed income instruments. Then there is the process of selecting the instruments as per the maturity dates. The one with the shortest maturity is taken first which may be a treasury bill. This price or the yield will be the interest for the shortest maturity in the yield curve.
Next, using the above yield, the forward rate of the next maturity is calculated, using interpolation techniques. After that the yield curve is extended by compounding the above implied forward rate with the current maturity yield. The derived result is the yield in the curve for the next maturity.
The above process continues by calculating the implied forward rates and taking the yield curve bootstrapping to the next maturity until the calculation covers the desired maturity range. In each step, the yield of the previous maturity is used, and the implied forward rate is calculated.
It is important to validate the yield curve against any additional market prices or yields. This will ensure the reliability and accuracy of the curve that has been derived. There are some techniques like the cubic spines or any other interpolation methods, which will make the curve stable.
Examples
Some suitable bootstrapping yield curve example given below will help in understanding the concept better.
The following are examples of bootstrapping yield curve in excel.
Example #1
Consider different bonds with a face value of $ 100, with the yield to maturity equal to the coupon rate. The coupon details are as below:
| Maturity | 0.5 Year | 1 Year | 1.5 Year | 2 Year |
| Yield to Maturity | 3% | 3.50% | 4.50% | 6% |
Solution:
Now, for a zero-coupon with a maturity of 6 months, it will receive a single coupon equivalent to the bond yield. Hence, the spot rate for the 6-month zero-coupon bond will be 3%.
For a 1-year bond, there will be two cash flows, at 6 months and at 1 year.
The cash flow at 6 months will be (3.5%/2 * 100 = $ 1.75) and cash flow at 1 year will be (100 + 1.75 = $ 101.75) i.e. principal payment plus the coupon payment.
From the 0.5-year maturity the spot rate or the discount rate is 3% and let us assume the discount rate for 1-year maturity be x%, then
- 100 = 1.75/(1+3%/2)^1 + 101.75/(1+x/2)^2
- 100-1.75/(1+3%/2)=101.75/(1+x%/2)^2
- 98.2758 = 101.75/(1+x%/2)^2
- (1+x%/2)^2 =101.75/ 98.2758
- (1+x%/2)^2 = 1.0353
- 1+x%/2 = (1.0353)^(1/2)
- 1+x%/2 = 1.0175
- x% = (1.0175-1)*2
- x% = 3.504%
Solving the above equation, we get x = 3.504%
Now, again for a 2 year bond maturity,
- 100 = 3/(1+3%/2)^1 + 3/(1+3.504%/2)^2 + 3/(1+4.526%/2)^3 + 103/(1+x/2)^4
- 100 = 2.955665025 + 2.897579405 + 2.805211867 + 103/(1+x/2)^4
- 100-8.658456297 = 103/(1+x/2)^4
- 91.3415437 = 103/(1+x/2)^4
- (1+x/2)^4 = 103//91.3415437
- (1+x/2)^4 = 1.127635858
- (1+x/2) = 1.127635858^(1/4)
- (1+x/2) = 1.030486293
- x = 1.030486293-1
- x = 0.030486293*2
- x = 6.097%
Solving for x we get, x = 6.097%
Similarly, for a 1.5-year bond maturity
100 = 2.25/(1+3%/2)^1 + 2.25/(1+3.504/2)^2 + 102.25/(1+x/2)^3
Solving the above equation, we get x = 4.526%
Thus, the bootstrapped zero yield curves will be:
| Maturity | Zero Rates |
|---|---|
| 0.5 Year | 3% |
| 1 Year | 3.50% |
| 1.5 Year | 4.53% |
| 2 Year | 6.10% |
Example #2
Here we go through another bootstrapping yield curve example. Let us consider a set of zero-coupon bonds of face value $ 100, with maturity 6 months, 9 months and 1 year. The bonds are zero-coupon i.e. they do not pay any coupon during the tenure. The prices of the bonds are as below:
| Period | Maturity | Price($ |
|---|---|---|
| Months | 6 | 99 |
| Months | 9 | 98.5 |
| Year | 1 | 97.35 |
Solution:
Considering a linear rate convention,
FV = Price*(1+ r*t)
Where r is the zero-coupon rate, t is the time
Thus, for 6-month tenure:
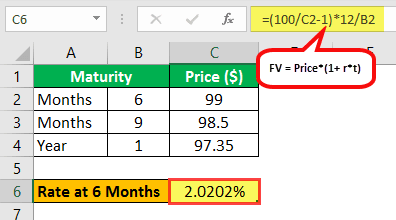
- 100 = 99*(1 + R6*6/12)
- R6 = (100/99 – 1)*12/6
- R6 = 2.0202%
For 9-month Tenure:
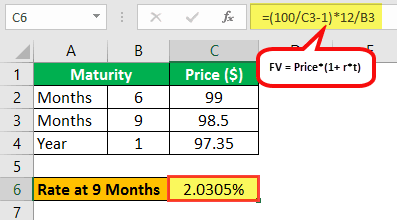
- 100 = 99*(1 + R9*6/12)
- R9 = (100/98.5 – 1)*12/9
- R9 = 2.0305%
For 1-year Tenure:
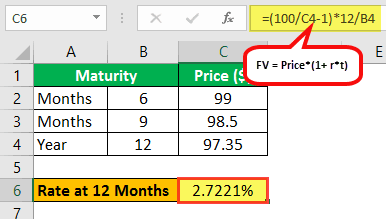
- 100 = 97.35*(1 + R12*6/12)
- R12 = (100/97.35 – 1)*12/12
- R12 = 2.7221%
Hence, the bootstrapped zero-coupon yield rates will be:
| Maturity | Zero Coupon (Rates) |
|---|---|
| 6 Months | 2.02% |
| 9 Months | 2.03% |
| 1 Year | 2.72% |
Note that the difference between the first and second example is that we have considered the zero-coupon rates to be linear in example 2 whereas they are compounding in example 1.
Example #3
Although this is not a direct example of a yield curve bootstrapping, sometimes one must find the rate between two maturities. Consider the zero-rate curve for the following maturities.
| Maturity | Zero Coupon (Rates) |
|---|---|
| 6 | 2.50% |
| 1 Year | 3.50% |
| 3 Year | 5% |
| 4 Year | 5.50% |
Now, if one needs the zero-coupon rate for 2-year maturity, he needs to linearly interpolate the zero rates between 1 year and three years.
Solution:
Calculation of zero-coupon discount rate for 2 year –
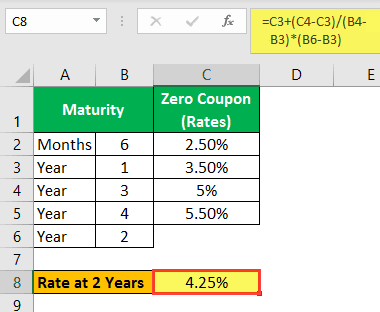
Zero-coupon rate for 2 year = 3.5% + (5% – 3.5%)*(2- 1)/(3 – 1) = 3.5% + 0.75%
Zero-Coupon Rate for 2 Years = 4.25%
Hence, the zero-coupon discount rate to be used for the 2-year bond will be 4.25%
Thus, the above examples make the concept of bootstrapping yield curve from swap rates or form bonds very clear.

Frequently Asked Questions (FAQs)
Are there any limitations or assumptions in bootstrapping yield curves?
Bootstrapping assumes that the bonds used in the process are free from credit risk and liquidity issues. It also assumes that the bond market is efficient and that the prices of bonds accurately reflect their fair values. However, it is important to note that these assumptions may not always hold true, and deviations from them could affect the accuracy of the yield curve estimation.
Can bootstrapping yield curve be used for all types of bonds?
Bootstrapping is commonly used for fixed-rate coupon bonds, as they have predictable cash flows. However, it may not be suitable for bonds with complex structures or embedded options. In such cases, alternative methods or models may be required to estimate the yield curve accurately.
What instruments could be used to bootstrap a yield curve?
Various instruments can be used to bootstrap a yield curve, depending on the available market data and the specific requirements of the analysis. Common instruments include government bonds, corporate bonds, Treasury bills, and interest rate swaps. These instruments provide a range of maturities and yield levels that can be used to construct the yield curve.
Recommended Articles
This has been a guide to what is Bootstrapping Yield Curve. We explain the concept with some suitable examples.. You can learn more about fixed income from the following articles –