Part of our Bond Pricing & Yield Curves guide
What Is The Term Structure?
The term structure refers to the relationship shared between interest rates or yields on a bond and a range of different maturities. The term structure of interest rates plays an important part in any economy by predicting the future trajectory of rates and facilitating quick comparison of yields based on time.
When plotted on the graph, it is known as the yield curve. The term structure models compare the instruments of same quality with different maturity period. This technique is used for valuation of different financial products available in the market.
Term Structure Explained
The term structure definition states how the structure of the interest rates over different maturities influence the valuation of the financial products or instruments in the market. The structure implies the shape that forms when the different yields on a bond are plotted on the graph against different maturities.
The shape or pattern obtained when figures are graphed depicts the status of an economy. When it comes to the shapes or pattern, there are three forms that are mostly evident when the interest rates and maturities are plotted on the graph.
One is the upward sloping graph, which depicts that the ling-term yields are higher than the short-term ones. Such pattern exhibits a progressive economy and it is a normal term structure pattern obtained.
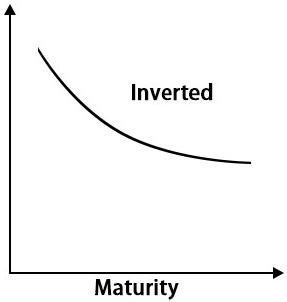
The second one is the downward sloping pattern, which indicates that short-term yields are better than long-term rates. It is also signified as an inverted curve, depicting a recessive period around the corner.
The third one is a flat yield curve, which indicates confusion about the further direction in which the economy is likely to move. It is indicated by little difference between the short- and long-term interest rates.
The term structure of interest rates is one of the most potent predictors of economic well being. All recessions in the past have been linked to inverted yield curves, showing how important a role they play in the credit market. Yield curves aren’t ever constant. They keep changing, reflecting the current market mood, helping the investors and financial intermediaries stay on top of everything.
Types
Primarily, the term structure of interest rates can take the following forms:
#1 – Normal/Positive Yield
The normal yield curve has a positive slope. This stands true for securities with longer maturities that have greater risk exposure as opposed to short term securities. So rationally, an investor would expect higher compensation (yield), thus giving rise to a normal positively sloped yield curve.
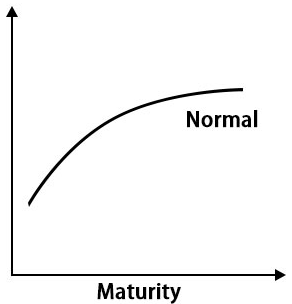
Bond yields or interest rates are plotted against X-axis while time horizons are plotted on Y-Axis.
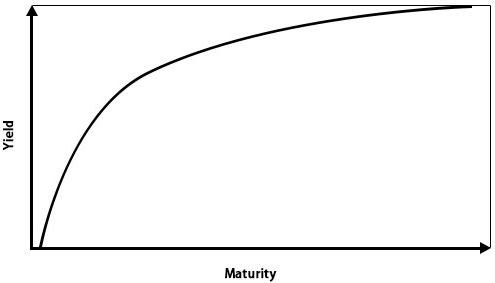
#2 – Steep
The steep yield curve is just another variation of the normal yield curve, just that a rise in interest rates occurs at a faster rate for long-maturity securities than the ones with a short maturity.
#3 – Inverted/Negative Yield
An inverted curve forms when there is a high expectation of long-maturity yields falling below short maturity yields in the future. An inverted yield curve is an important indicator of the imminent economic slowdown.
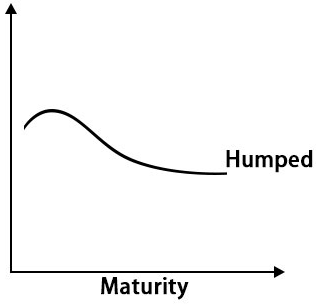
#4 – Humped/Bell-Shaped
This type of curve is atypical and very infrequent. It indicated that yields for medium-term maturity are higher than both long and short terms, eventually suggesting a slowdown.
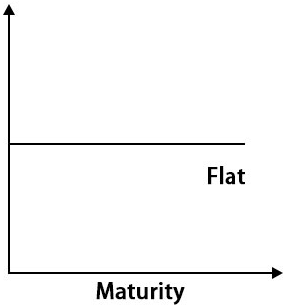
#5 – Flat
A Flat curve indicates similar returns for long-term, medium-term, and short-term maturities.
Theories
Any study of the term structure is incomplete without its background theories. They are pertinent in understanding why and how are the yield curves so shaped. Let us have a look at different term structure theories that exist:
#1 – The Expectations Theory/Pure Expectations Theory
Expectations theory states that current long-term rates can be used to predict short term rates of future. It simplifies the return of one bond as a combination of the return of other bonds. For e.g., a 3-year bond would yield approximately the same return as three 1-year bonds.
#2 – Liquidity Preference Theory
This theory perfects the more commonly accepted understanding of liquidity preferences of investors. Investors have a general bias towards short-term securities, which have higher liquidity as compared to long-term securities, which get one’s money tied up for a long time. Key points of this theory are:
- The price change for long term debt security is more than that for a short term debt security.
- Liquidity restrictions on long term bonds prevent the investor from selling it whenever he wants.
- The investor requires an incentive to compensate for the various risks he is exposed to, primarily price risk and liquidity risk.
- Less liquidity leads to an increase in yields, while more liquidity leads to falling yields, thus defining the shape of upward and downward slope curves.
#3 – Market Segmentation Theory/Segmentation Theory
This theory is related to the supply-demand dynamics of a market. The yield curve shape is governed by the following aspects:
- Preferences of investors for short term and long term securities.
- An investor tries to match the maturities of his assets and liabilities. Any mismatch can lead to capital loss or income loss.
- Securities with varying maturities form a number of different supply and demand curves, which then eventually inspire the final yield curve.
- Low supply and high demand lead to an increase in interest rates.
#4 – Preferred Habitat Theory
This theory states that investor preferences can be flexible, depending on their risk tolerance level. They can choose to invest in bonds outside their general preference also if they are appropriately compensated for their risk exposure.
These were some of the main theories dictating the shape of a yield curve, but this list is not exhaustive. Theories like Keynesian economic theory and substitutability theory have also been proposed.
Example
Let us consider the following instance to understand the concept better:
In January 2023, the term structure of interest rates seemed to portray a negative slope, which indicated upcoming recession in the economy of the United States. The analysts depicted that the US Treasury securities would exhibit higher yields in major parts of the 2023, but then the later part of the year would witness the yields going the down.
The US Treasury yield curve acts as the benchmark for the credit sector. This is because these curves are obtained keeping into account the yield generated through risk-free fixed income investments with different maturity periods.
The example above shows how the fluctuating US Treasury yield can indicate the direction of an economy.
Benefits
Studying term structure is a must to keep on assessing the direction in which the economy is to move. There are numerous other benefits of this model. Some of them have been mentioned below:
- Indicator of the overall health of the economy – An upward sloping and steep curve indicates good economic health while inverted, flat, and humped curves indicate a slowdown.
- Knowing how interest rates might change in the future, investors are able to make informed decisions.
- It also serves as an indicator of inflation.
- Financial organizations have a heavy dependency on the term structure of interest rates since it helps in determining rates of lending and savings.
- Yield curves give an idea of how overpriced or under-priced the debt securities may be.
Risks
Despite having lots of advantages, term structure exhibits some limitations as well. Let us have a look at the disadvantages that these models have:
- Yield curve risk – Investors who hold securities with yields depending on market interest rates are exposed to yield curve risk to hedge against which they need to form well-differentiated portfolios.
- Maturity matching to hedge against yield curve risk is not a straightforward task and might not give the desired end results.
- The term structure of interest rates eventually is only a predicted estimation that might not always be accurate, but it has hardly ever fallen out of place.
Recommended Articles
This has been a guide to what is Term Structure. Here, we explain the concept along with risks associated with it, its types, theories, an example, and its benefits. Here are the other articles in fixed income that you may like –
Recommended Articles
Continue with these closely related articles from the same guide.