What Is Descriptive Statistics In Excel?
Descriptive Statistics in Excel summarizes the statistical data using the available information in the dataset. This technique also provides us with various types of output options.
The Excel Descriptive Statistics function is an inbuilt tool found in the “Data Analysis” group of the “Data” tab.
For example, we have 2 student data, as shown below.

When we apply the Descriptive Statistics In Excel we get the output shown below.

Key Takeaways
- Descriptive Statistics in Excel derives a bundle of statistical results such as Mean, Std Dev, Median, Mode, Skew, Range, Min, Max, Count, etc.,
- If the “Data Analysis” option is not seen, we must enable it from the Analysis ToolPak first, and then it will be found in the “Data” tab ribbon.
- As per the options selected in the “Descriptive Statistics” window, the required details will be derived, i.e., the SUMMARY will be based on the data selection we make in the step shown.
How To Enable Descriptive Statistics In Excel?
The steps to enable theDescriptive Statistics option in Excelare,
- First, we must go to “File”, and then “Options.”

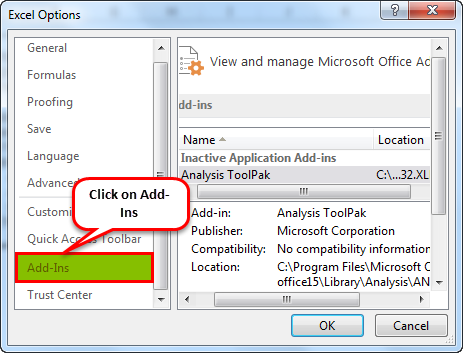
- Next, we need to go to “Add-ins.”

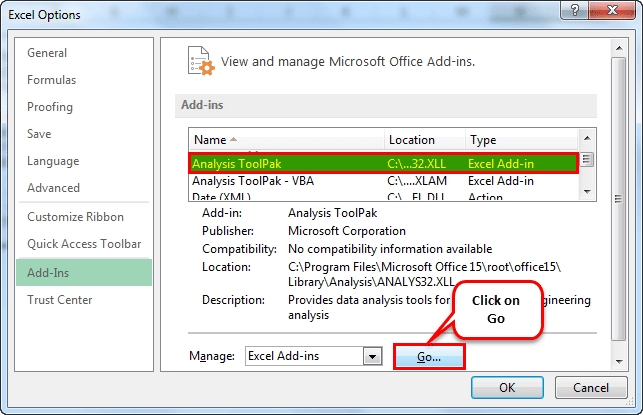
- We may see all the inactive applications under “Add-ins” on the right-hand side. Select “Analysis Toolpak”, and click “Go.”

- Now we must see the “Data Analysis” option under the “Data” tab.
We must click on “Data Analysis.” Thus, we may see all the available analysis techniques like Anova, T-Test, F-Test in Excel, Correlation, Histogram, Regression,Descriptive Statistics, and many more.

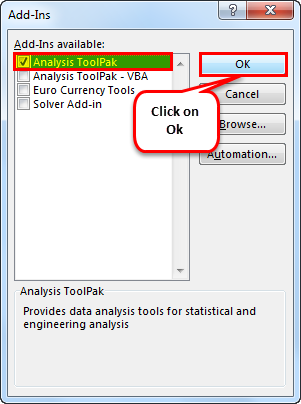
- Now, we will have all the add-ins available for Excel. Select “Analysis ToolPak”, and click “OK.”


How To Use Descriptive Statistics In Excel?
We can use Descriptive Statistics In Excel as follows:
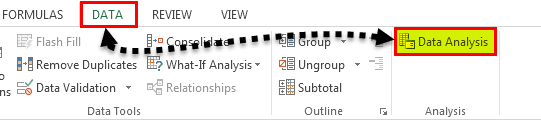
First, select the “Data” tab → go to the “Analysis” group → click the “Data Analysis” option, as shown below.
[Note: If the “Data Analysis” option is not found in the “Data” tab ribbon, then we must enable it following the procedure we learned in the previous section.]
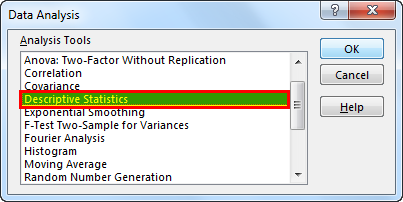
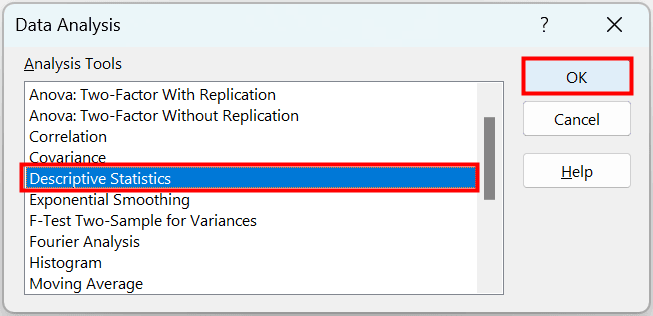
The “Data Analysis” window opens. Here, select the “Descriptive Analysis” option from the “Analysis Tools” category, and click “OK”, as shown below.

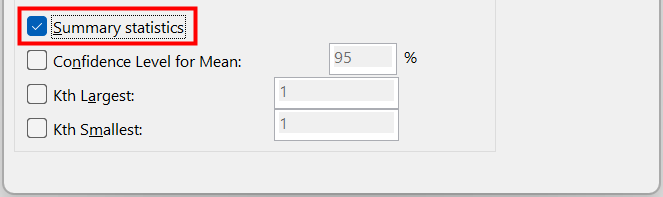
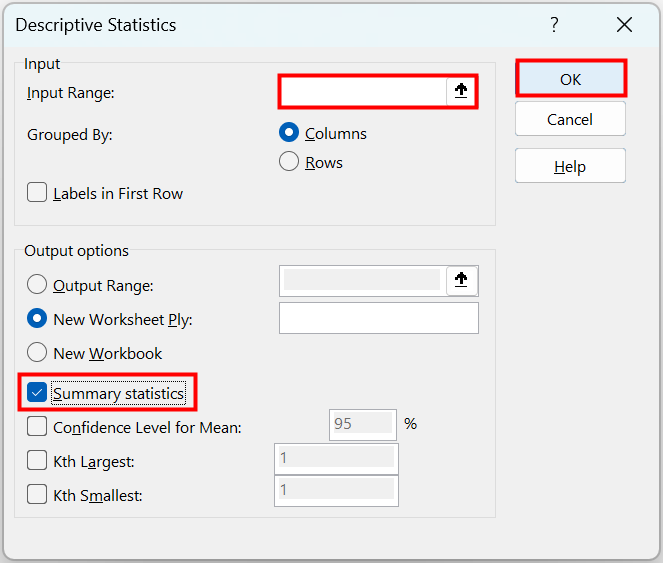
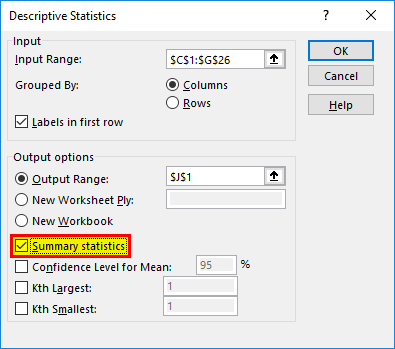
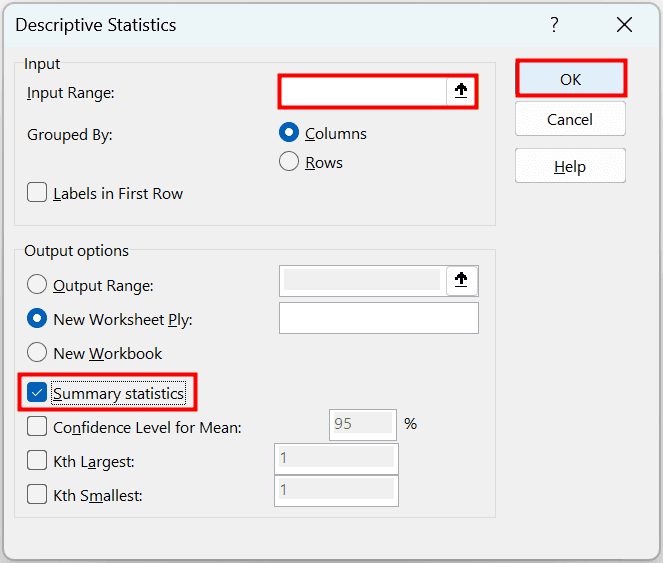
Then, the “Descriptive Statistics” window opens. Here, add the required details such as the cell range in the “Input Range:”, check/tick the “Summary Statistics” checkbox, and click “OK” to get the Descriptive Summary.
Examples
We will consider some advanced scenarios to use Descriptive Statistics In Excel.
Example #1
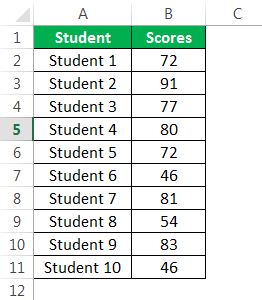
Now, let us look at the simple data from a test, which includes the scores of 10 students. Using this data of scores, we need Descriptive Statistics data analysis.
We must first copy this data to our Excel sheet.
- Step 1: Then, Go to Data → Data Analysis.

- Step 2: On clicking “Data Analysis,” we get the list of all the available analysis techniques. After that, scroll down and select “Descriptive Statistics”.
- Step 3: Under “Input Range,” select the “Scores range,” including the heading. Then, check “Labels in the first row”, choose “Output Range,” give cell reference as D1 and check summary statistics.
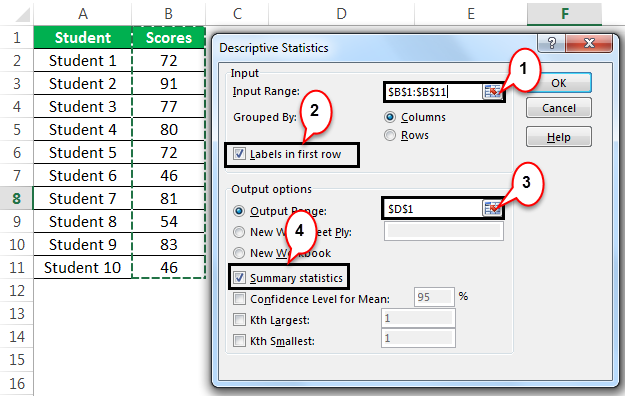
- Step 4: Next, we must click “OK” to complete the task. In the D1 cell, we may see the summary report of Descriptive Statistics data analysis.
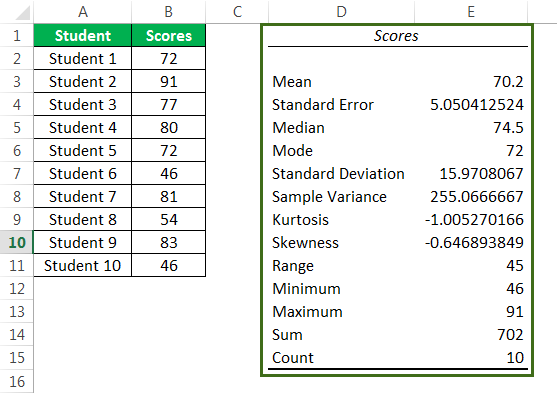
We got various statistical results from the selected data, i.e., scores.
The average score (mean) is 70.2, and the standard deviation is 15.97. Also, the minimum score is 46. At the same time, the maximum score is 91. So, the total score sum is 702, and the total number of students in this sample is 10. Like this, we have all kinds of statistical results.
Example #2
We have learned how Descriptive Statistics works in the previous example. Download the workbook to this Descriptive Statistics in Excel.
We have a list of students, their age, gender, height, weight, weekly hours of study, and recent examination score details for a few students.

By looking at the above data, the common questions are: What is the average age of the student group? Average weight, Average exam score, Average height, Maximum value in each category, Minimum value, etc.
We have as many as five different categories to tell the statistical results. Therefore, we can conduct a descriptive statistical analysis to find all these.
- Step 1: We must go to Data → Data Analysis.

- Step 2: On clicking “Data Analysis,” we get the list of all the available analysis techniques. After that, scroll down and select “Descriptive Statistics.”

- Step 3: Under “Input Range,” we must select all the category ranges, including headings, i.e., C1:G26.
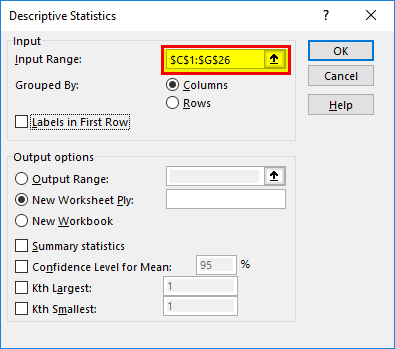
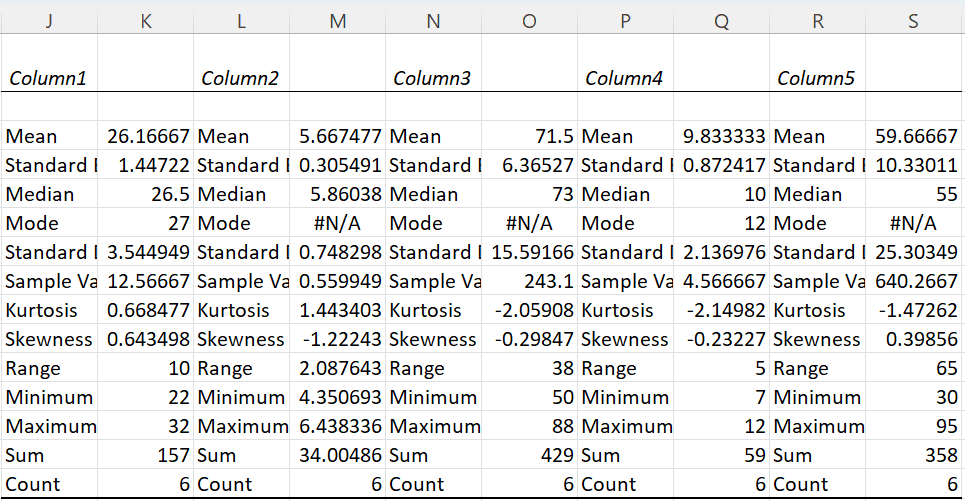
We can get the summary result in the same worksheet, different worksheets, and workbooks. Then, based on our selection, it will show the summary report. We have demonstrated the summary in the same worksheet, i.e., from the J1 cell.

Since we have selected the headings, we need to tick the checkbox “Labels in the first row.” Because we have chosen the headers, it will be helpful while showing the results. Otherwise, understanding each category’s results would not be very clear.
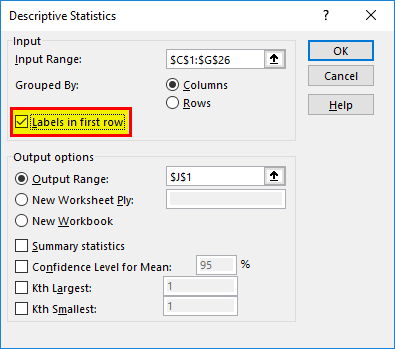
And then, tick the Summary Statistics option.
- Step 4: After that, we must click “OK” to complete the test. We will get the Descriptive Statistics results from the J1 cell.
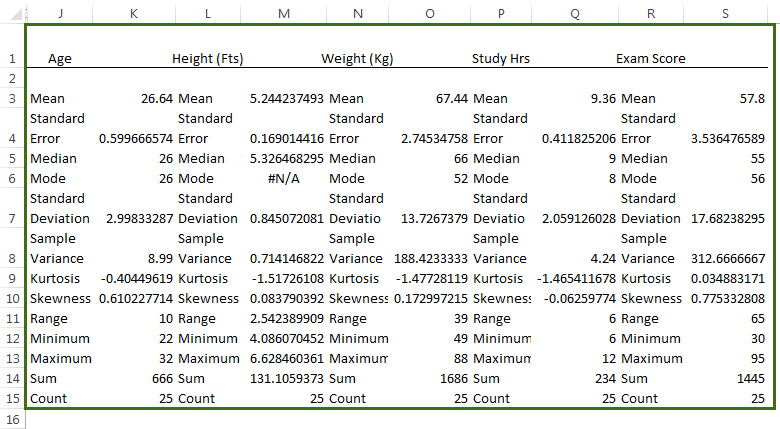
It has shown up all the statistical results for all five categories. So, for example, the total number of students is 25, the average age is 26.64, the average height is 5.244, the average weight is 67.44, and the average exam score is 57.8, which is relatively low compared to modern-day standards and many other results.
Important Things To Note
- “Label as first row” means the data range we have selected includes headings.
- We can find the average value using the AVERAGE function in excel and the maximum and minimum value using the MAX and MIN functions, respectively.
Frequently Asked Questions (FAQs)
What is the purpose of Descriptive Statistics in Excel?
Descriptive Statistics gets the summary of the selected dataset. It helps us derive the details related to the statistical variations such as Mean, Mode, Median, etc.
Where is the Descriptive Statistics in Excel found?
We can use Descriptive Statistics In Excel as follows:
First, select the “Data” tab → go to the “Analysis” group → click the “Data Analysis” option, as shown below.
The “Data Analysis” window opens. Here, select the “Descriptive Analysis” option from the “Analysis Tools” category, and click “OK”, as shown below.
Why is the Descriptive Statistics in Excel not working?
The Descriptive Statistics may give an error if we have not selected any of the following options such as “Summary Statistics”, “Confidence Level for Mean”, etc., in the following image step.
Recommended Articles
This article is a guide to Descriptive Statistics in Excel. Here, we discuss using descriptive statistics tools in Excel and practical examples, and downloadable Excel templates. You may learn more about Excel from the following articles: –