Part of our Trading Orders guide
What Is Volume Of Trade?
The volume of trade is the overall measure of the number of securities, i.e., shares or contracts traded during a particular trading day. It means how many securities have exchanged hands of ownership between buyers and sellers for executing a trade related to bonds, stocks, options, futures contracts, and different types of commodities.
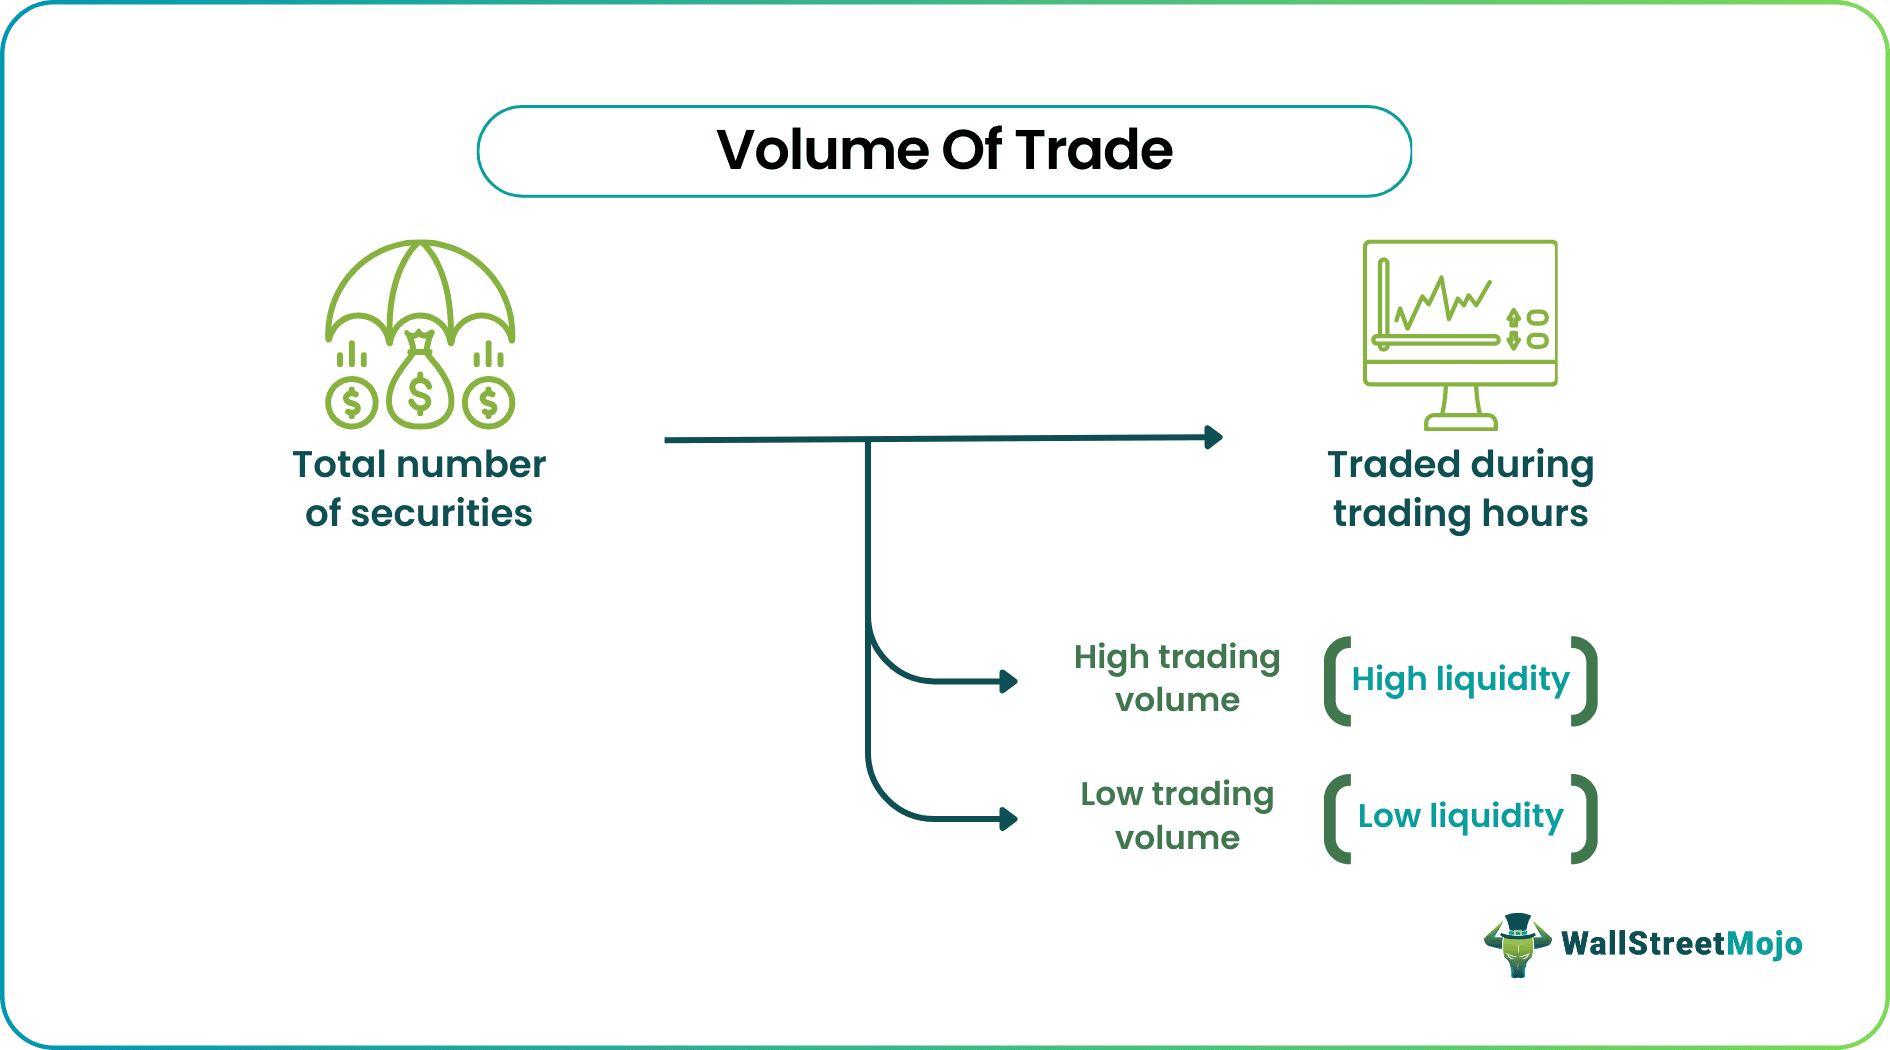
A higher volume of trade for particular security means more liquidity is attached; the security has better order execution and a more available market for connecting buyers with sellers. The volume of trade is a very important parameter for trading. It acts as one of the important technical indicators for traders based on which they can decide whether to enter into a trade or exit from a business. In addition, it tells us how liquid the asset is. All the stock market exchanges calculate and provide this information.
- The volume of trade refers to the full measure of the number of securities, i.e., shares or contracts traded during a specific trading day. A higher volume of trade for a specific security means more liquidity attachment. The security possesses better order execution and a more available market for associating buyers with sellers.
- It performs like the most straightforward technical indicator.
- Traders use the trade volume to know the liquidity level associated with a specific asset. It also indicates that it is easy for a trader to enter and get out of stock or contract, depending on the asset’s activeness level.
- Finally, it helps traders know about interested buyers and sellers for a specific stock and at what prices one may enter or leave the stock or contract. Therefore, traders use the volume of trade as a winning strategy.
Volume Of Trade Explained
The volume of trade in the securities market refers to the total quantity of the financial instruments that change hands during the trading hours in the financial market. The instruments may be stocks, bonds, derivatives, etc, which are bought and sold by traders and investors during the market hours. This volume is a very important indicator of liquidity and activity level taking place in the market.
It can be said to be an ideal measure of total number of securities traded, which can be daily, weekly, monthly or yearly. The volume of trade in stock market can be directly related to the liquidity level, where a higher volume signifies more buy and sell going on because the market is liquid. But this high trade levels can also lead to heavy price fluctuations. This can again lead to sudden price changes, change in interest rates and the market trends may be reversed. Trend reversal may be positive or negative.
However, volume of securities traded in the financial market also indicates investor sentiments. Analysts use this parameter to successfully interpret the way the market may move in the days to come, which largely depends on what the market participants think about the stock or any other financial instrument. Any positive or negative news may impact the view of the investors which may again increase of decrease the trading volume.
The volume of any security trade has increased considerably during the last few years due to advancement in technology and usage of algorithms and computer applications that do the job within limited timeframe and high level of accuracy. However, it is to be noted that the volume may be seasonal too. They also depend on economic and market conditions.
Market participants, financial analysts, and investors track the daily trades volume to understand and identify profit-making opportunities.
Example
Let us take the example of the New York Stock Exchange to understand the concept. Here, we typically take a scenario of three stocks listed in the markets. Based on these three, we will calculate the volume of the trade. For example, suppose the stocks are Apple, AT&T, and Verizon. Let us assume the first trader buys 1,000 shares of Apple and sells 500 shares of AT&T. The other trader now buys 1,000 shares of AT&T and sells 500 shares of Verizon to the first trader. Thus, the total volume of shares traded on this particular day is 2,000 (1,000 of Apple+ 500 of AT&T+ 500 of Verizon). Thus, the net impact of buying and selling the respective shares on a particular trading day gives us the trade volume.
Video Explanation of Volume Of Trade

How To Calculate?
The volume of trade one may express as the total number of stocks or contracts exchanged between buyers and sellers of specific security during the trading hours of a trading day. The volume of trade in the stock market measures the activity prevailing in the market, and the liquidity available. It can help the investor or the trader decide on specified times related to the transaction. It also acts like the simplest technical indicator. All the market exchanges track this data and present the volume data. The volume of the trade numbers is reported hourly throughout the entire trading day. This trade volume, which gets noted hourly, is termed an estimate. The figure, written at the end of the day, is also called an estimate. The full and final figure for a particular day is reported the following day.
Chart
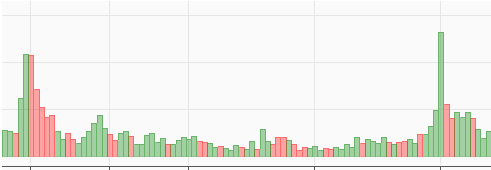
In trade, volume of trade formula means the number of units transacted in buying or selling stocks and contracts over a particular time or a trading day. Traders may rely heavily upon it because it shows the asset’s liquidity level and how easily one can get in or out of the stock or contract. Generally, there are two types of volumes: buying and selling volumes. The stock is very easy to buy and sell when the volume is high. On the other hand, when the volume of trade formula signifies that the volume is low, it is not easy to buy or sell the stock. That is because there must be a buyer and seller for a successful trade. When this is marked on a chart, it is the trade chart’s volume. Generally, it is shown by a bar chart. Volume bars are usually colored red or green. A green volume bar means that the price of the share of contracts has gone high during the particular trading day, and the estimate provided based on it is “buy,” or the stock is considered buying volume. On the other hand, when the color of the volume bars is red, the price has declined during the trading day, and a selling volume is estimated based on the same.
Trading Volume For Traders
The volume of trade is a very significant technical indicator for traders. Traders use this to understand the level of liquidity attached to a particular asset. It also points out how easy it will be for a trader to enter and come out of stock or contract based on the level of activeness of the asset. Finally, it helps traders understand how many interested buyers and sellers are present for a particular stock and at what prices one can enter or leave the stock or contract. Thus, traders use it as a winning strategy.
Advantages
The concept has many advantages in the financial market. Let us study them to understand the process thoroughly.
- It shows the level of liquidity attached to the asset. Higher trading shows high liquidity level in the market.
- It acts as one of the key technical indicators for traders. . It helps them to confirm which way the market is moving and identify the potential chance to make profits from the trends, because technical analysis is essential to get a strong conviction about the market condition.
- It helps the traders to understand the point of entry and exit of the particular investment. Technical analysis is a helpful tool to point out the entry and exit points so that maximum profit is earned and losses are minimized. The commonly used methods for this kind of analysis, like Moving Average Convergence Divergence (MACD) or Relative Strength Index (RSI), are combined with the volume to get a firm confirmation.
- It is a key aspect to consider when traders opt for intra-day trading. They need to have a very good understanding of the interpretation of volume. Traders do short term buying and selling ànd so it the volume is high, then their profit has the chance of going up considerably. The changes in price does not impact them much and they can easily enter and exit.
- It helps to understand the momentum in security and identify a trend.
As more and more trades occur in the market, the efficiency improves, and the process becomes more transparent. It becomes difficult for any single entity to dominate or take control of the entire market. It provides the participants with valuable information and promotes a trading environment that is transparent, fair, and competitive. Thus, studying the volume and other important trading indicators is necessaryto understand and analyze the market in the best way possible.
Frequently Asked Questions (FAQs)
What was the volume of trade between U.S. and China?
U.S. exports to China in 2021 were $151.1 billion, a 21.4% ($26.6 billion) increase from 2020; the U.S. imports from China were $506.4 billion, a 16.5% ($71.6 billion) increase. Conversely, the trade deficit with China was $355.3 billion, a 14.5% ($45.0 billion) increase.
What is volume of trade in international economics?
The trade volume means the total number of shares or contracts traded between security buyers and sellers in trading hours on a given day. It is a market’s activity measure and liquidity during the time.
What is the volume of trade in AfCFTA?
AfCFTA may increase trade value to $12bn and lessens trade cost by 20 percent through providing achievement of an omnibus bill on AfCFTA. It executes trade and infrastructure programs or enhances competition. Moreover, it also evolves adequate capacity and arrowhead products and services export.
What is volume of trade between China and Japan?
According to the United Nations COMTRADE database on international trade, China’s exports to Japan were U.S. $165.82 billion in 2021. China exports to Japan – data, historical chart, and statistics. It was last updated on January 2023.
Recommended Articles
This article is a guide to what is Volume Of Trade. We explain how to calculate it, the chart, example, trading volume for traders and advantages. You may learn more about financing from the following articles: –