What Is Earnings Multiplier?
Earnings Multiplier, known as the Price-to-Earnings Ratio, is a method to compare the current market price of a share to the company’s earnings per share. In simple words, it is a measure of valuation to determine what you are willing to pay for every single amount of dollar a company can earn.
If you want to invest in the shares of any company, it is vital to know the right stock price for that company. It should not be overvalued or undervalued. You need to compare the amount invested and the return you will get from it. It is calculated through a Price Earnings ratio.
Price-Earnings Ratio has to be compared with the peers or Industry Average.
Earnings Multiplier Formula
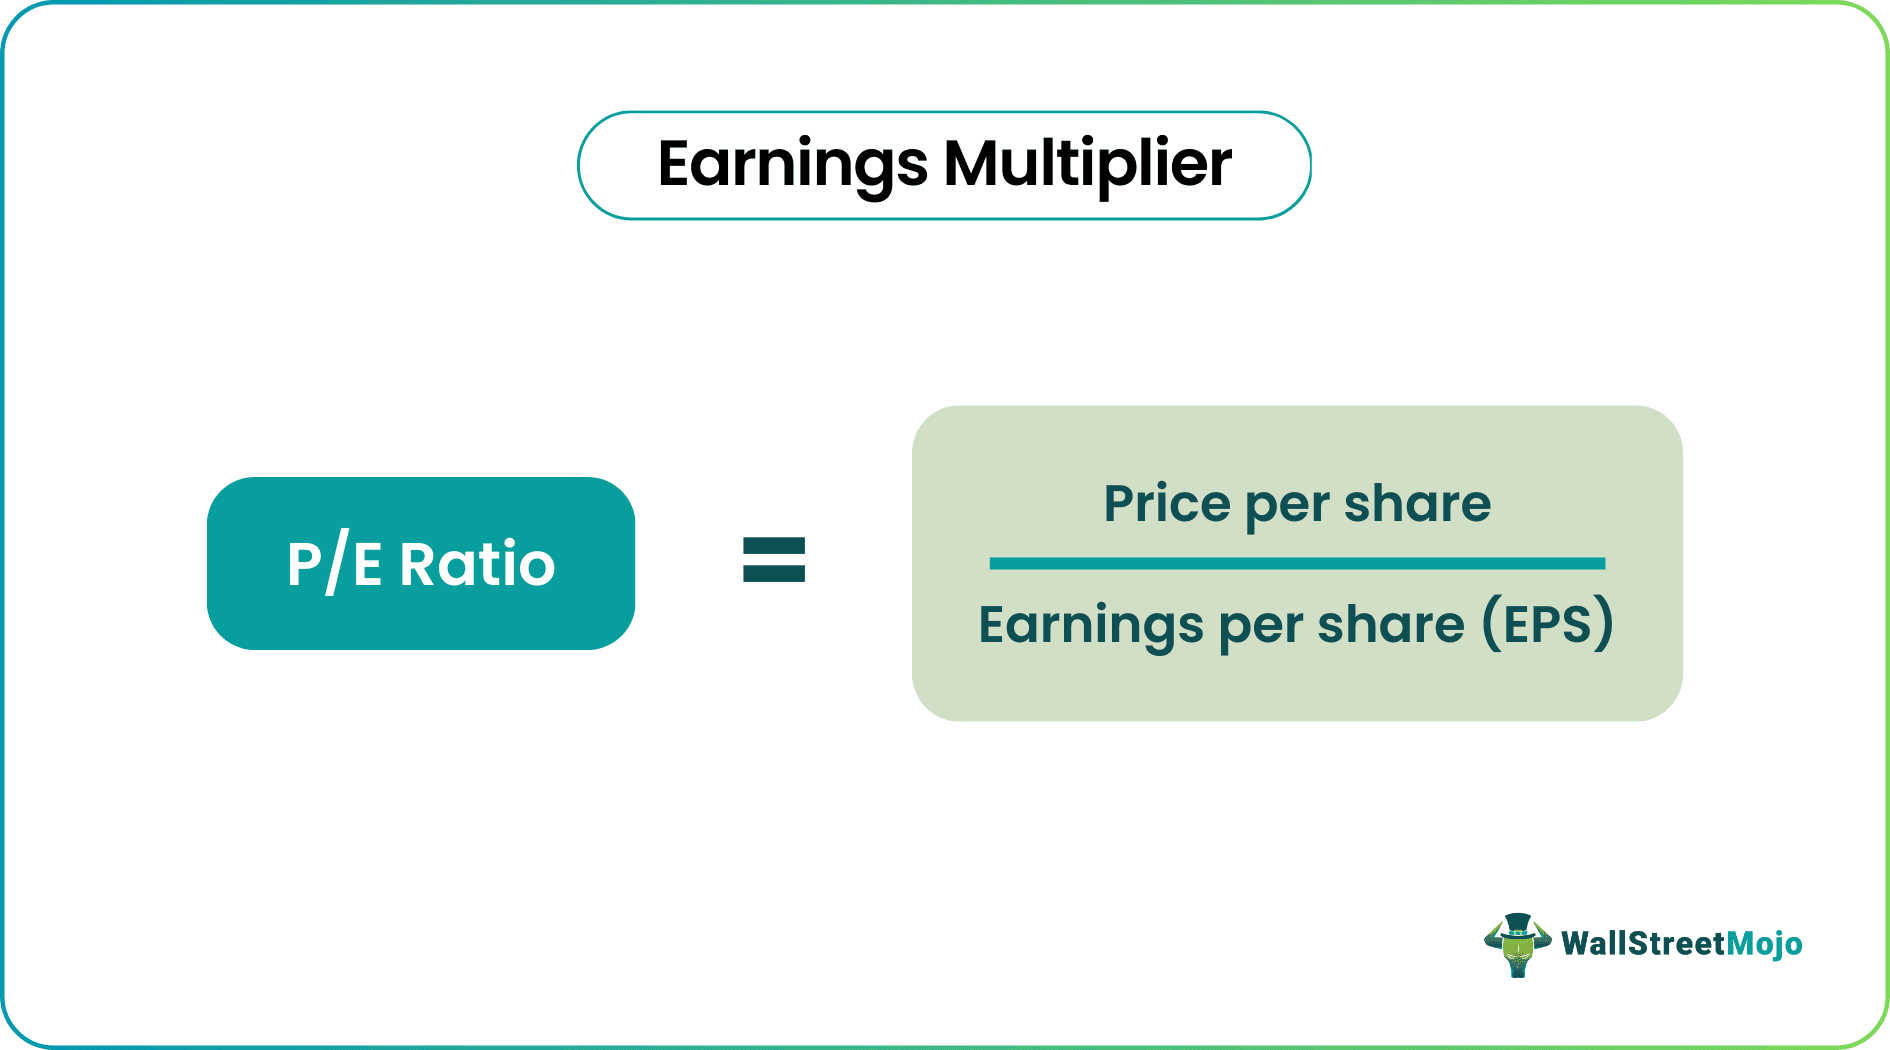
Price-to-Earnings Ratio is represented as follows –
P/E Ratio = Price Per Share / Earnings Per Share (EPS)
- Price per share is the current market price of the company’s share. In simple words, it is the price at which a company’s share is currently trading in the market.
- Earnings per share are calculated as the net profits of a company divided by the total number of shares of a company.
Examples of Earnings Multiplier
Let’s understand this concept with the help of examples.
Example #1
Company A is currently trading at $150 per share, and earnings per share are calculated as $10. So let’s calculate the P/E ratio here.
Solution
Calculation of P/E Ratio of Company A

- = 150 / 10
- P/E Ratio = 15
Calculation of P/E Ratio of Company B

- =300/15
- P/E Ratio = 20
A P/E ratio of 15 indicates that an investor is willing to pay 15 times the company’s current value.
To determine whether a company’s P/E ratio is high or low, we need to compare it with its industry peers.
The average industry P/E is 18. So here, we can say that company B’s share is expensive compared to industry standards.
Example #2 – Low P/E, Low Growth
As per the below table, the company’s earnings per share are increasing at a rate of 10% every year, and the share price is also increasing at the same rate. As a result, the P/E ratio remains the same every year.

Example #3 – High P/E, High Growth
Here, the company is growing at a 100% rate every year. The earnings per share are getting doubled in years 2 and 3. The price of the share is also increasing at a high rate. Hence, the P/E ratio is also maintained high.

Example #4 – Low P/E, Negative Growth
The table below shows the company’s negative growth over the years 2 & 3. Since the earnings per share are declining, the share price is also reducing. As a result, the P/E ratio is also reducing.

Example #5 – Moderate P/E, Steady Growth
Here, the earnings per share and market price of shares of the company are increasing at a very high rate, but the price-to-earnings ratio is not increasing at the same rate. But, again, it happens mostly in the case of cyclical companies.

Refer to the excel sheet given above for detailed calculations.
Revenue vs. Earnings Video Explanation

Reasons for High P/E and Low P/E
Here are a few reasons for low P/E –
- Undervalued stock: The stock price may be valued at a lower rate.
- Low growth or negative growth: Companies’ P/E ratio depends upon the company’s growth.
- Prospects: If the company’s prospects are not great, it will result in low P/E.
Here are a few reasons for High P/E –
- Stock is overvalued: More investors are interested in the company’s stock, which will result in a higher price and higher P/E ratio.
- High Growth: A company’s P/E ratio depends upon the company’s growth.
- Prospects: If the company’s prospects are expected to be great, it will result in high P/E.
Importance
- The earnings multiplier or P/E ratio is an essential tool to know about the company’s financial health.
- Investors can compare the P/E ratio of various companies and decide where the investment is to be made.
- P/E ratio also indicates how the company is performing compared to the industry peers.
Conclusion
Hence, the price-to-earnings ratio is an essential tool to analyze the company’s stock. The P/E ratio compares its stock price to its earnings per share. A Higher P/E ratio could imply higher growth prospects for the company or the stock is overvalued. On the other hand, a lower P/E ratio indicates low growth or undervaluation of stock.
Recommended Articles
This article has been a guide to Earnings Multiplier. Here we discuss the formula for calculation of earnings multiplier along with its examples and reasons for high and low P/E. You may also have a look at the following articles –