What is an Equity Research Report?
An Equity Research Report is a document prepared by Equity Research Analysts or Financial brokers. It focuses on a specific stock or industry sector, currency, commodity or fixed-income instrument, or even a geographic region or country. They contain recommendations for buying or selling that stock, including DCF modeling, relative valuations, etc.
- The equity research report is a communication from a securities firm to its clients with a very specific purpose.
- It is intended to help an investor decide on the allocation of resources.
- All other purposes are secondary.
Who are the Clients of the Brokerage Firm?
A Financial broker is an intermediary between the clients and the investment world. Clients are large investment funds like Pension Funds, Life Insurance Companies, Mutual Funds, FIIs, etc. Brokers are organizations like J.P.Morgan, Goldman Sachs, Credit Suisse, Nomura, Morgan Stanley, etc.
Although brokers facilitate the investments, they also provide investment advice. Sometimes this investment advice is paid for by the clients. However, in most cases, investment advice is provided for free. “Brokerage houses sell their Ideas.” They charge commissions on each transaction executed through their trading division.
Clients receive more than 100+ research reports (ideas) emails from brokerage firms each day. Now think of this: more than 300+ brokerage firms are connected to these clients. Do you think the client has time to read all the research reports from head to toe?
We should understand that, at best, clients may spend not more than a minute or two minutes reading your research report. Your financial statement analysis report, if this is so, a 50+ page report would not make any sense. A novel-style research report is a trash!
Research reports must be crisp, to the point, and precise for the reasons above. We explore later the best practices for writing a research report.
Explanation of Equity Research in Video

Types of Equity Research Report
#1 – Initiation Report
- As the name suggests, these are the reports when the brokerage firms take coverage of the company. It means they started tracking the company for the first time.
- As this is the first research piece from the brokerage firm, it can typically be a detailed report and can vary from a 20-50 page report.
- This detailed report contains the stock details and overall competition, industry dynamics, etc.

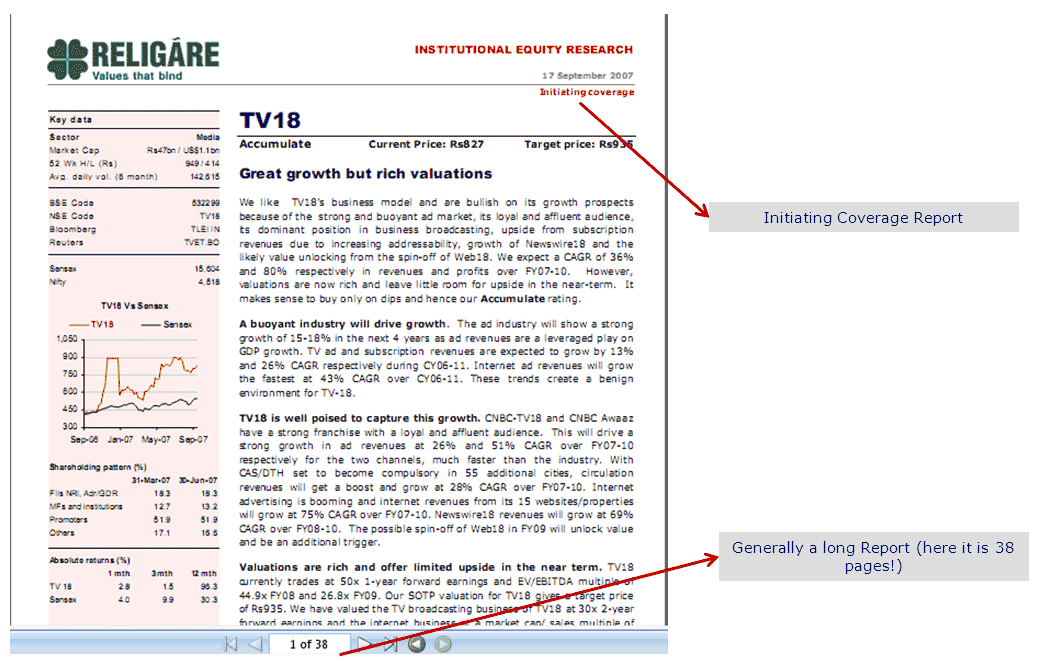
source: Religare research report
#2 – Sector Report
- Often, brokerage firms come up with Industry or Sector reports on the update.
- These reports, again, can be very exhaustive and helpful to clients.
- It provides deep insights into Industry dynamics, competitors, government regulations, and key forecasts.
source: Deutsche Bank research report
#3 – Strategic / Economic Reports
- These strategic or economic reports contain information on general macroeconomics, currency movements, commodities, etc.
- These reports are especially useful for portfolio managers to decide on country-specific fund flows.
- Also, research analysts use these strategic reports to incorporate any important correlation with their sectors.
source: Citibank research report
#4 – Quarterly Result Reports
- These are 2-3 page reports highlighting critical result updates.
- These reports are generally smaller and contain only vital highlights of quarterly/annual results.
source: JPMorgan research report
#5 – Flash Reports
- Flash news reports could be anything important that is worth communicating to clients.
- Sometimes, it could be just a quick email update or an alert.
- Events could be associated with important management changes, mergers, and acquisition, deal announcements, critical regulatory changes, etc.
Do’s & Don’ts of Equity Research Report Writing
Golden Rule
- Expectations from Dan Brown Novels are different; the climax comes at the last!
- Your Research Report is NOT anywhere close to novels, and it is diagonally opposite. Target price/recommendations come first!
KISS – Keep it simple silly!
- Readers hardly have 1-2 minutes to read your full report. They may not even scan till the 2nd page.
Timely Reports
- Issuing the report in a timely fashion
- For Example, a result update report after 2-3 days may not be considered for reading
The client is sophisticated and professional
- Always use to the point and precise points
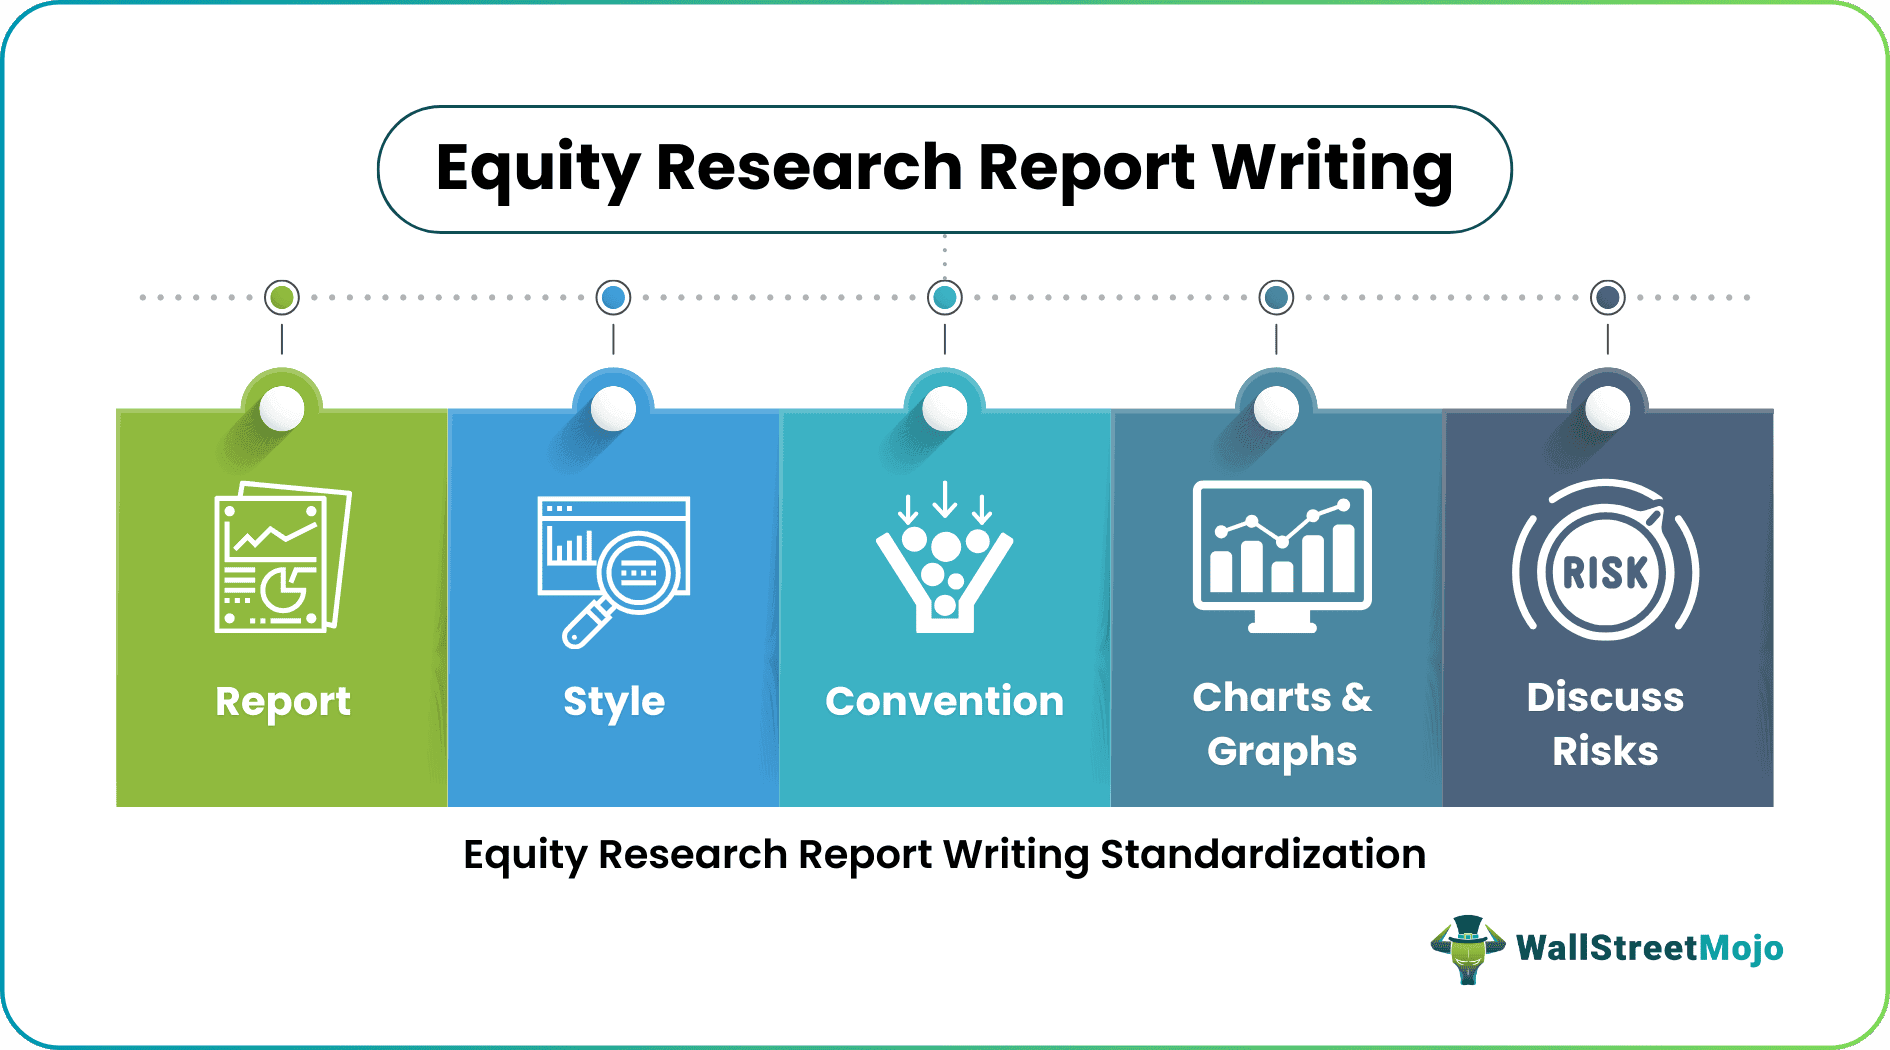
Equity Research Report Writing Standardization!
Report
Keep the report short (maximum 20 pages)
Use Headlines and comment flashes
Make the format and layout as uncluttered as you can
Style
Should be jargon-free – Avoid clichés, e.g., jack of all, the lion’s share
Be precise, clear, and concise
Use short words like ‘buy’ rather than ‘purchase.’
Use of active voice, e.g., ‘We forecast..’ is better than ‘it is forecasted to..’
Convention
Headings, Abbreviations
Bullet points, Currencies
Time, Dates
Names and Titles, Figures
Ranking, Upper Case, Lower Case, and Title Case
Charts and Graphs
Use charts and graphs – an appropriate picture is worth a thousand words.
Put data in a table
Discuss the risks
It would help if you discussed the risk.
Anatomy of Equity Research Report – First Page
Having understood the types of equity research reports, let us now look at the anatomy of the Research Report. The first page is the most crucial page of the report. There are critical sections of the report –
- Recommended Target Price & Stock Data
- Investment Report Summary
- Estimates & Valuation
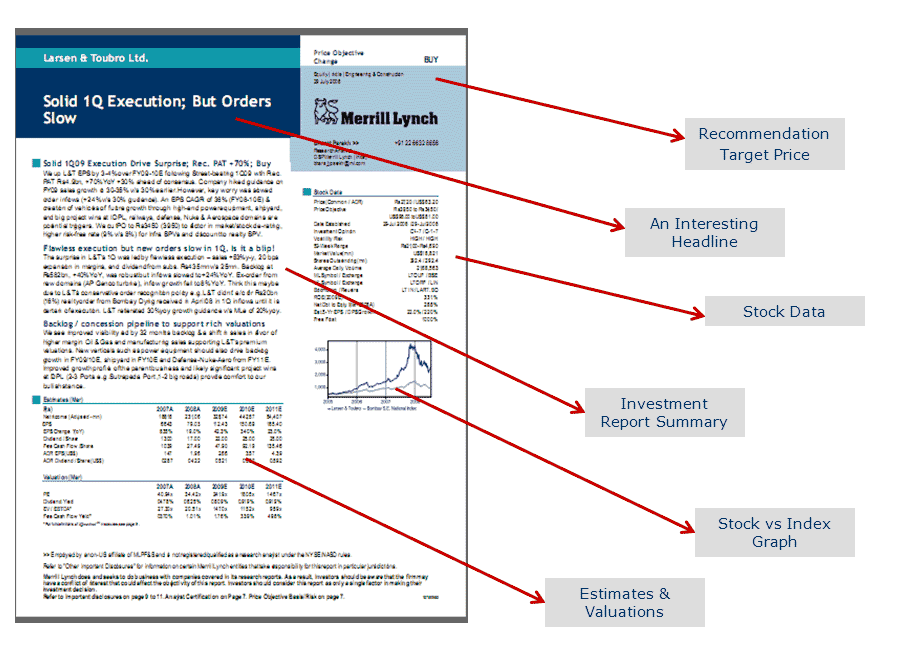
source: Merrill Lynch research report
1. Target Price & Stock Data
- This section contains the target price and other financial data.
- The idea of this section is to get a quick glimpse of key variables like Market Capitalization; Daily traded Volumes, Shares Outstanding, ROE, free float, etc.
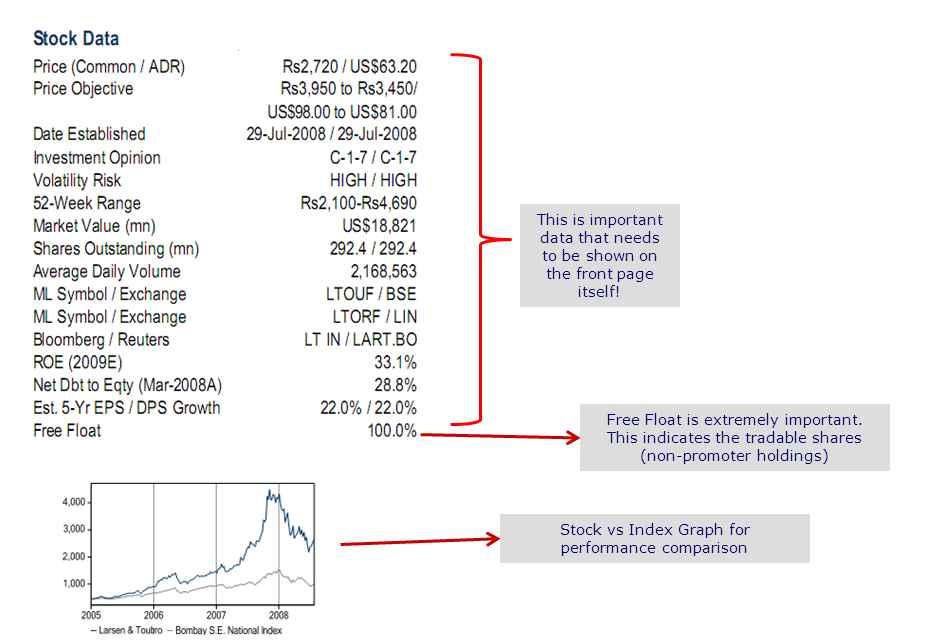
source: Merrill Lynch research report
2. Investment Report Summary
- It primarily contains 2-3 most important aspects of the report.
- One discussion point is generally on the valuations and the risks associated with the company

source: Merrill Lynch research report
3. Estimates & Valuation
- This section contains key estimates like Net Income, Profit, Dividends, etc. This section provides a quick glimpse of key forecasts to the clients.
- In addition, the report also contains valuation sections with key multiples like PE Ratio, Price to Book Value Ratio, EV/EBITDA, etc

source: Merrill Lynch research report
Equity Research Report Writing – Case Studies
Case Study 1 – General Guidelines
“1Q FY09 GDP rose 7.9% v/s 8.8% last quarter and 9.2% in 1QFY08. Growth was led by agriculture up 3%, industry up 6.9%, and services up 10%. GDP by expenditure indicates that while consumption growth at 7.9% was higher than trends in 1QFY08, investment growth decelerated to 9%- the first time below double-digits since 4QFY03. We expect these trends to continue in FY09.”
Some things to note in the above example
1QFY09 is used for representing 1st fiscal quarter of the year 2009 (writing in this style saves a lot of space for the report)
Observe how the increase and decrease in growth rate
v/s = versus
We expect….
Case Study 2 – Using Numbers
Heading – Solid 1Q Execution, But Orders Slow
Heading should be to the point and catch!
Solid 1Q09 Execution Drive Surprise; Rec. PAT +70%; Buy
We up L&T EPS by 3-4% over FY09-10E following Street-beating 1Q09 with Rec. PAT Rs4.9bn, +70%YoY +30% ahead of consensus. The company hiked guidance on FY09 sales growth to 30-35% v/s 30% earlier. However, the key worry was slowed order inflows (+24% v/s 30% guidance). An EPS CAGR of 36% (FY08-10E) & creation of vehicles of future growth through high-end power equipment, shipyard, and big project wins at IDPL, railways, defense, Nuke & Aerospace domains are potential triggers. We cut PO to Rs3450 (3950) to factor in market/stock de-rating, higher risk-free rate (9% v/s 8%) for Infra SPVs, and discount to realty SPV.
Case Analysis
Always subordinate numerical information to a non-numerical idea.
Y-o-Y – used year over year
“+70%” used to indicate a growth of 70%
CAGR = cumulative average growth rate
The language used is very professional.
Case Study 3 – Using Tables

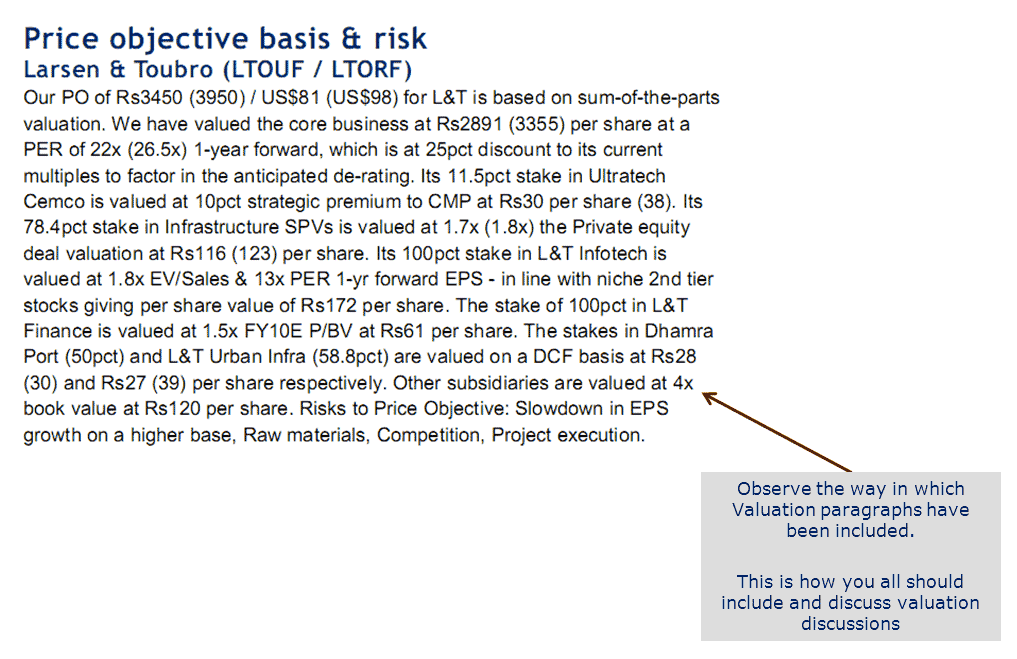
Case Study 4 – Valuation Discussion
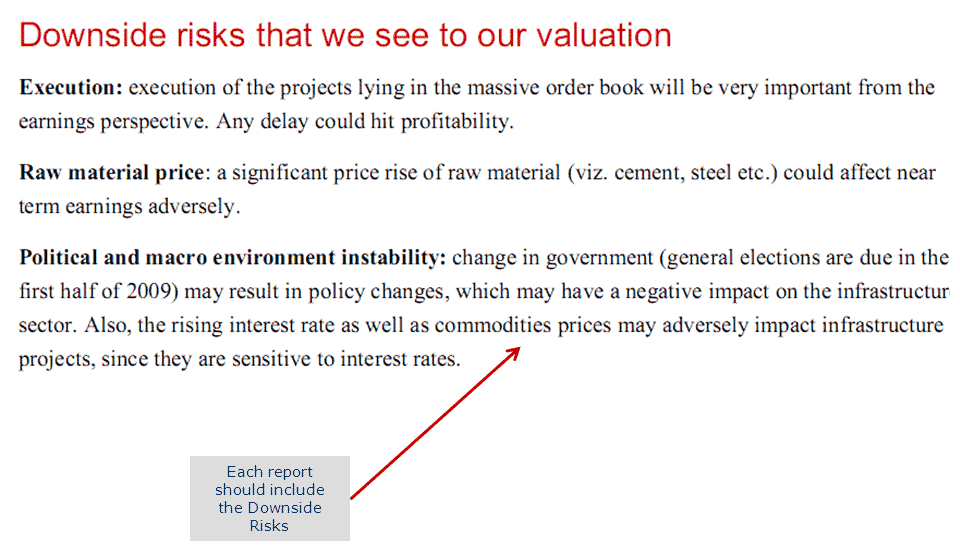
Case Study 5 – Risk Discussions
Using Readability Statistics – Flesch-Kincaid Grade
Readability statistics can provide significant inputs regarding the sophistication of your research report. Below is a quick summary of using Readability Statistics –
- In Word, click on the Windows button in the top left corner of your screen,
- Then click on Word Options; when you are in the Word Options pop-up, click on Proofing on the left;
- When correcting spelling and grammar in Word, make sure that Show readability statistics is checked.
Now, run spelling and grammar checks through your document. At the very end of the process, the Readability Statistics will pop up.
This score relates to US school grade levels. A score of 8.0, for instance, means that your writing is geared toward an eighth-grade reading level.
- For those not based in the US, grade levels relate to actual age as follows.
1st Grade 6–7
2nd Grade 7–8
3rd Grade 8–9
4th Grade 9–10
5th Grade 10–11
6th Grade 11–12
7th Grade 12–13
8th Grade 13–14
High school 9th Grade (Freshman) 14-15
10th Grade (Sophomore) 15-16
11th Grade (Junior) 16-17
12th Grade (Senior) 17–18
So a Flesch-Kincaid Grade Level score of 10 means that you are aiming roughly at ‘an educated reader’ of about 15 years old.
It would be best to remember that your research report is for sophisticated /educated users, and it should contain 12 and above grades.
Recommended Articles
This article has been a guide to Equity Research Report Writing. If you learned something new or enjoyed the post, please comment below. Let me know what you think. Many thanks, and take care. Happy Learning!