Equity Research Interview Questions
If you are called for an equity research interview, you can be asked any question from anywhere. However, you should not take this lightly as this can change your Finance career. Equity Research interview questions are a mix of technical and tricky questions. So, you need to have a thorough knowledge of financial analysisFinancial AnalysisFinancial analysis is an analysis of finance-related projects/activities, company's financial statements (balance sheet, income statement, and notes to accounts) or financial ratios to evaluate the company's results, performance, and trends, which is useful for making significant decisions such as investment, project planning and financing activities.read more, valuation, financial modeling, the stock market, current events, and stress interview questions.
Let’s find below the top 20 Equity Research interview questions that are repeatedly asked for the positions of equity research analystsEquity Research AnalystsAn equity research analyst is a qualified professional who interprets financial information and trends of an organization or industry to provide recommendations, opinions, reports, and projections on the corporate stocks to facilitate equity trading.read more.
Table of contents
You are free to use this image o your website, templates, etc, Please provide us with an attribution linkHow to Provide Attribution?Article Link to be Hyperlinked
For eg:
Source: Equity Research Interview Questions (with Answers) (wallstreetmojo.com)
Question #1 – Do you know the difference between equity and enterprise values? How are they different?
This is a simple conceptual equity research interview question, and you need first to mention the definition of enterprise valueDefinition Of Enterprise ValueEnterprise value (EV) is the corporate valuation of a company, determined by using market capitalization and total debt.read more and equity value and then tell the differences between them.
Enterprise value can be expressed as follows –
- Enterprise Value = Market Value of Common Stock + Market Value of Preferred Stock + Market Value of Debt + Minority InterestMinority InterestMinority interest is the investors' stakeholding that is less than 50% of the existing shares or the voting rights in the company. The minority shareholders do not have control over the company through their voting rights, thereby having a meagre role in the corporate decision-making.read more – Cash & Investments.
Whereas, the equity value formulaEquity Value FormulaEquity Value, also known as market capitalization, is the sum-total of the values the shareholders have made available for the business and can be calculated by multiplying the market value per share by the total number of shares outstanding.read more can be expressed as follows –
- Equity Value = Market CapitalizationMarket CapitalizationMarket capitalization is the market value of a company’s outstanding shares. It is computed as the product of the total number of outstanding shares and the price of each share.read more + Stock Options + Value of equity issued from convertible securities – Proceeds from converting convertible securities.
The basic difference between enterprise value and equity value is enterprise value helps investors get a complete picture of a company’s current financial affairs. In contrast, equity value helps them shape future decisions.
Now you can Master Financial Modeling with Wallstreetmojo’s premium courses at special prices
Best Financial Modeling Courses by Wallstreetmojo
Financial Modeling Course
* 12+ Hours of Video
* Certificate
Financial Modeling & Valuation
* Valuations
* 25+ Hours of Video
* Certificate of Completion
Valuation Course
* 12+ Hours of Video
* Certificate
Question # 2- What are the most common ratios used to analyze a company?
It can be classified as the most common equity research interview question. Here is the list of common ratios for financial analysis that can be divided into seven parts –
#1 – Solvency RatioSolvency RatioSolvency Ratios are the ratios which are calculated to judge the financial position of the organization from a long-term solvency point of view. These ratios measure the firm’s ability to satisfy its long-term obligations and are closely tracked by investors to understand and appreciate the ability of the business to meet its long-term liabilities and help them in decision making for long-term investment of their funds in the business.read more Analysis
- Current RatioCurrent RatioThe current ratio is a liquidity ratio that measures how efficiently a company can repay it' short-term loans within a year. Current ratio = current assets/current liabilities read more
- Quick RatioQuick RatioThe quick ratio, also known as the acid test ratio, measures the ability of the company to repay the short-term debts with the help of the most liquid assets. It is calculated by adding total cash and equivalents, accounts receivable, and the marketable investments of the company, then dividing it by its total current liabilities.read more
- Cash RatioCash RatioCash Ratio is calculated by dividing the total cash and the cash equivalents of the company by total current liabilities. It indicates how quickly a business can pay off its short term liabilities using the non-current assets.read more
#2 – Turnover Ratios
- Receivables Turnover
- Days Receivables
- Inventory TurnoverInventory TurnoverInventory Turnover Ratio measures how fast the company replaces a current batch of inventories and transforms them into sales. Higher ratio indicates that the company’s product is in high demand and sells quickly, resulting in lower inventory management costs and more earnings.read more
- Days InventoryDays InventoryDays Inventory Outstanding refers to the financial ratio that calculates the average number of days of inventory held by the company before selling it to the customers, providing a clear picture of the cost of holding and potential reasons for the delay in the inventory sale.read more
- Accounts Payable Turnover
- Days Payable
- Cash Conversion CycleCash Conversion CycleThe Cash Conversion Cycle (CCC) is a ratio analysis measure to evaluate the number of days or time a company converts its inventory and other inputs into cash. It considers the days inventory outstanding, days sales outstanding and days payable outstanding for computation.read more
#3 – Operating Efficiency Ratio Analysis
- Asset Turnover RatioAsset Turnover RatioThe asset turnover ratio is the ratio of a company's net sales to total average assets, and it helps determine whether the company generates enough revenue to justify holding a large amount of assets under the company’s balance sheet.read more
- Net Fixed Asset Turnover
- Equity TurnoverEquity TurnoverThe equity turnover ratio depicts the organization's efficiency to utilized the shareholders' equity to generate revenue. It is evaluated by dividing the total sales from the average shareholders' equity. read more
#4 – Operating Profitability Ratio Analysis
- Gross Profit MarginGross Profit MarginGross Profit Margin is the ratio that calculates the profitability of the company after deducting the direct cost of goods sold from the revenue and is expressed as a percentage of sales. It doesn’t include any other expenses into account except the cost of goods sold.read more
- Operating Profit MarginOperating Profit MarginOperating Profit Margin is the profitability ratio which is used to determine the percentage of the profit which the company generates from its operations before deducting the taxes and the interest and is calculated by dividing the operating profit of the company by its net sales.read more
- Net Margin
- Return on Total AssetsReturn On Total AssetsReturn on Total Assets is a measure of a company's income proceeds left for shareholders divided by the total assets owned by the company. ROA = Net Income/Total Assets.read more
- Return on EquityReturn On EquityReturn on Equity (ROE) represents financial performance of a company. It is calculated as the net income divided by the shareholders equity. ROE signifies the efficiency in which the company is using assets to make profit.read more
- Dupont ROEDupont ROEDuPont formula determines the return on equity (ROE), depicting the efficient utilization of shareholders' capital into the business for generating revenue. The formula is "Return on Equity (ROE) = Profit Margin * Total Asset Turnover * Leverage Factor".read more
#5 – Business RiskBusiness RiskBusiness risk is associated with running a business. The risk can be higher or lower from time to time. But it will be there as long as you run a business or want to operate and expand.read more
- Operating LeverageOperating LeverageOperating Leverage is an accounting metric that helps the analyst in analyzing how a company’s operations are related to the company’s revenues. The ratio gives details about how much of a revenue increase will the company have with a specific percentage of sales increase – which puts the predictability of sales into the forefront.read more
- Financial LeverageFinancial LeverageFinancial Leverage Ratio measures the impact of debt on the Company’s overall profitability. Moreover, high & low ratio implies high & low fixed business investment cost, respectively. read more
- Total Leverage
#6 – Financial RiskFinancial RiskFinancial risk refers to the risk of losing funds and assets with the possibility of not being able to pay off the debt taken from creditors, banks and financial institutions. A firm may face this due to incompetent business decisions and practices, eventually leading to bankruptcy.read more
- Leverage RatioLeverage RatioDebt-to-equity, debt-to-capital, debt-to-assets, and debt-to-EBITDA are examples of leverage ratios that are used to determine how much debt a company has taken out against its assets or equity.read more
- Debt to Equity RatioDebt To Equity RatioThe debt to equity ratio is a representation of the company's capital structure that determines the proportion of external liabilities to the shareholders' equity. It helps the investors determine the organization's leverage position and risk level. read more
- Interest Coverage Ratio
- Debt Service Coverage RatioDebt Service Coverage RatioDebt service coverage (DSCR) is the ratio of net operating income to total debt service that determines whether a company's net income is sufficient to cover its debt obligations. It is used to calculate the loanable amount to a corporation during commercial real estate lending.read more
#7 – External Liquidity RiskLiquidity RiskLiquidity risk refers to 'Cash Crunch' for a temporary or short-term period and such situations are generally detrimental to any business or profit-making organization. Consequently, the business house ends up with negative working capital in most of the cases.read more
- Bid-Ask Spread FormulaBid-Ask Spread FormulaThe asking price is the lowest price at which a prospective seller will sell the security. The bid price, on the other hand, is the highest price a prospective buyer is willing to pay for a security, and the bid-ask spread is the difference between them.read more
Question #3 What is Financial Modeling, and how is it useful in Equity Research?
- This is again one of the most common equity research interview questions. Financial modeling is nothing but projecting the company’s finances in a very organized manner. As the companies that you evaluate only provide historical financial statements, this financial model helps equity analysts understand the fundamentals of the company – ratios, debt, earnings per shareEarnings Per ShareEarnings Per Share (EPS) is a key financial metric that investors use to assess a company's performance and profitability before investing. It is calculated by dividing total earnings or total net income by the total number of outstanding shares. The higher the earnings per share (EPS), the more profitable the company is.read more, and other important valuation parameters.
- In financial modeling, you forecast the company’s balance sheet, cash flows, and income statement for the future years.
- You may refer to examples like the Box IPO Financial ModelBox IPO Financial ModelOn 24th March,2014, Online storage company Box filed for an IPO and unveiled its plans to raise US$250 million. The company is in race to be build the largest cloud storage platform and it competes with the biggies like Google Inc and its rival, Dropbox.read more and Alibaba Financial ModelAlibaba Financial ModelAlibaba is the most profitable Chinese e-commerce company and its IPO is a big deal due to its size. With its huge size and network, Alibaba IPO may look at international expansion beyond China and may lead to price wars and intensive competition in the US.read more to understand more about Financial Modeling.
Question #4 – How do you do a Discounted Cash Flow analysisDiscounted Cash Flow AnalysisDiscounted cash flow analysis is a method of analyzing the present value of a company, investment, or cash flow by adjusting future cash flows to the time value of money. This analysis assesses the present fair value of assets, projects, or companies by taking into account many factors such as inflation, risk, and cost of capital, as well as analyzing the company's future performance.read more in Equity Research?
If you are new to the valuation model, please go through this Free training on Financial Modeling.
- Financial modeling starts with populating the company’s historical financial statements in a standard format.
- After that, we project these three statements using a step-by-step financial modeling techniqueFinancial Modeling TechniqueFinancial modeling refers to the use of excel-based models to reflect a company's projected financial performance. Such models represent the financial situation by taking into account risks and future assumptions, which are critical for making significant decisions in the future, such as raising capital or valuing a business, and interpreting their impact.read more.
- The three statements are supported by other schedules like the Debt and Interest Schedule, Plant and Machinery & Depreciation Schedule, Working Capital, Shareholders EquityShareholders EquityShareholder’s equity is the residual interest of the shareholders in the company and is calculated as the difference between Assets and Liabilities. The Shareholders' Equity Statement on the balance sheet details the change in the value of shareholder's equity from the beginning to the end of an accounting period.read more, Intangible and Amortization Schedules, etc.
- Once the forecast is done, you move to valuations of the firm using the DCFDCFDiscounted cash flow analysis is a method of analyzing the present value of a company, investment, or cash flow by adjusting future cash flows to the time value of money. This analysis assesses the present fair value of assets, projects, or companies by taking into account many factors such as inflation, risk, and cost of capital, as well as analyzing the company's future performance.read more approach,
- Here you are required to calculate Free Cash Flow to Firm or Free Cash Flow to Equity and find the present valuePresent ValuePresent Value (PV) is the today's value of money you expect to get from future income. It is computed as the sum of future investment returns discounted at a certain rate of return expectation.read more of these cash flows to find the fair valuation of the stock.
Question #5 – What is Free Cash Flow to a Firm?
This is a classic equity research interview question. Free cash flow to the firm is the excess cash that is generated after considering the working capital requirements and the cost associated with maintaining and renewing the fixed assets. The firm’s free cash flow goes to the debt holders and the equity holders.
Free Cash Flow to Firm or FCFF Calculation = EBIT x (1-tax rate) + Non Cash Charges + Changes in Working capital – Capital Expenditure
You can learn more about FCFF hereFCFF HereFCFF (Free cash flow to firm), or unleveled cash flow, is the cash remaining after depreciation, taxes, and other investment costs are paid from the revenue. It represents the amount of cash flow available to all the funding holders – debt holders, stockholders, preferred stockholders or bondholders.read more.
Question #6 – What is Free Cash Flow to Equity?
Though this question is frequently asked in valuation interviews, this can be an expected equity research question. FCFE measures how much “cash” a firm can return to its shareholders and is calculated after taking care of the taxes, capital expenditureCapital ExpenditureCapex or Capital Expenditure is the expense of the company's total purchases of assets during a given period determined by adding the net increase in factory, property, equipment, and depreciation expense during a fiscal year.read more, and debt cash flows.
The FCFE model has certain limitations. For example, it is useful only in cases where the company’s leverage is not volatile and cannot be applied to companies with changing debt leverage.
FCFE Formula = Net Income + DepreciationDepreciationDepreciation is a systematic allocation method used to account for the costs of any physical or tangible asset throughout its useful life. Its value indicates how much of an asset’s worth has been utilized. Depreciation enables companies to generate revenue from their assets while only charging a fraction of the cost of the asset in use each year. read more & Amortization + Changes in WC + Capex + Net Borrowings
You can learn more about FCFE hereFCFE HereFCFE (Free Cash Flow to Equity) determines the remaining cash with the company's investors or equity shareholders after extending funds for debt repayment, interest payment and reinvestment. It is an indicator of the company's equity capital managementread more.
Question #7 – What’s the earning season? How would you define it?
Appearing for an equity research interview? – Be sure to know this equity research interview question.
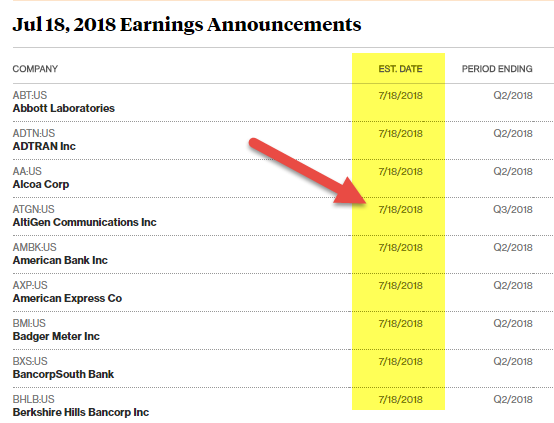
source: Bloomberg.com
In our industry, companies will announce a specific date when they declare their quarterly or annual results. These companies will also offer a dial-in number using which we can discuss the results.
- One week before that specific date, the job is to update a spreadsheet, reflecting the analyst’s estimates and key metrics like EBITDA, EPS, Free Cash Flow, etc.
- On the day of the declaration, the job is to print the press release and swiftly summarize the key points.
You can refer to this article to learn more about the earning earning seasonEarning SeasonThe Earnings season refers to the quarterly report of companies' results, such as revenue/profits, released in the first two weeks after each quarter ends (Dec, Mar, Jun, Sep). It helps investors in making investment decisions and determining the value of their investments.read more.
Question #8 – How do you do a Sensitivity AnalysisSensitivity AnalysisSensitivity analysis is a type of analysis that is based on what-if analysis, which examines how independent factors influence the dependent aspect and predicts the outcome when an analysis is performed under certain conditions.read more in Equity Research?
One of the technology equity research interview questions.
- Sensitivity analysis using excelSensitivity Analysis Using ExcelSensitivity analysis in excel helps us study the uncertainty in the output of the model with the changes in the input variables. It primarily does stress testing of our modeled assumptions and leads to value-added insights. In the context of DCF valuation, Sensitivity Analysis in excel is especially useful in finance for modeling share price or valuation sensitivity to assumptions like growth rates or cost of capital.read more is one of the most important tasks after you have calculated the fair value of the stock.
- Generally, we use the base case assumptions of growth rates, WACC, and other inputs, which result in the base valuation of the firm.
- However, to provide the clients with a better understanding of the assumptions and their impact on valuations, you must prepare a sensitivity table.
- The sensitivity table is prepared using DATA TABLES in Excel.
- Sensitivity analysis is popularly done to measure the effect of changes in WACC and the company’s growth rate on Share Price.
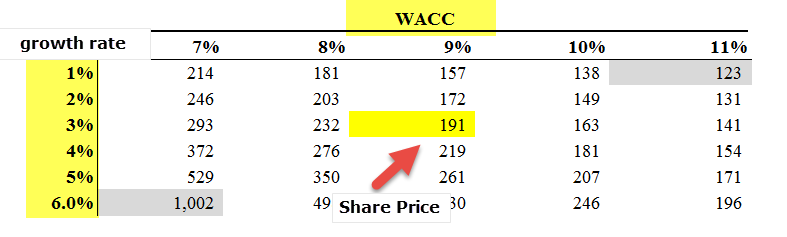
- As we see above, in the base case assumption of a Growth rate of 3% and WACC of 9%, Alibaba’s Enterprise Value is $191 billion.
- However, when we can make our assumptions to say a 5% growth rate and WACC of 8%, we get the valuation of $350 billion!
Question #9 – What is the “restricted list,” and how does it affect your work?
This is a nontechnical equity research interview question. To ensure that there is no conflict of interest, a “restricted list” is being created.
When the investment banking team is working on closing a deal that our team has covered, we’re not allowed to share any reports with the clients, and we will not be able to share any estimates. Our team will also be restricted from sending any models and research reports to clients. We will also not be able to comment on the merits or demerits of the deal.
Question #10 – What are the most common multiples used in valuation?
Expect this expected equity research interview question. There are a few common multiples that are frequently used in valuation –
- EV/SalesEV/SalesEV to Sales Ratio is the valuation metric which is used to understand company’s total valuation compared to its sales. It is calculated by dividing enterprise value by annual sales of the company i.e. (Current Market Cap + Debt + Minority Interest + preferred shares – cash)/Revenueread more
- EV/EBITDAEV/EBITDAEV to EBITDA is the ratio between enterprise value and earnings before interest, taxes, depreciation, and amortization that helps the investor in the valuation of the company at a very subtle level by allowing the investor to compare a specific company to the peer company in the industry as a whole, or other comparative industries.read more
- EV/EBITEV/EBITThe EV to EBIT ratio is an important valuation metric that determines whether a company's stock is expensive or cheap in comparison to the broader market or a competitor.read more
- PE RatioPE RatioThe price to earnings (PE) ratio measures the relative value of the corporate stocks, i.e., whether it is undervalued or overvalued. It is calculated as the proportion of the current price per share to the earnings per share. read more
- PEG RatioPEG RatioThe PEG ratio compares the P/E ratio of a company to its expected rate of growth. A PEG ratio of 1.0 or lower, on average, indicates that a stock is undervalued. A PEG ratio greater than 1.0 indicates that a stock is overvalued.read more
- Price to Cash FlowPrice To Cash FlowPrice to Cash Flow Ratio is a value indicator that measures a company's stock price in relation to the cash flow amount it generates. This is determined as the ratio of Price Per Share to Operating Cash Flow Per Share. read more
- P/BV RatioP/BV RatioPrice to Book Value Ratio or P/B Ratio helps to identify stock opportunities in Financial companies, especially banks, and is used with other valuation tools like PE Ratio, PCF, EV/EBITDA. Price to Book Value Ratio = Price Per Share / Book Value Per Share read more
- EV/AssetsEV/AssetsThe EV to Assets Ratio is an important valuation metric that is used to compare the value of a company to its total assets. It is calculated by dividing the enterprise value by the company's total assets.read more
Question #11 – How do you find the Weighted Average Cost of CapitalWeighted Average Cost Of CapitalThe weighted average cost of capital (WACC) is the average rate of return a company is expected to pay to all shareholders, including debt holders, equity shareholders, and preferred equity shareholders. WACC Formula = [Cost of Equity * % of Equity] + [Cost of Debt * % of Debt * (1-Tax Rate)]read more of a company?
WACC is commonly referred to as the Firm’s Cost of Capital. This is because the cost to the company for borrowing the capital is dictated by the external sources in the marketExternal Sources In The MarketAn external source of finance is the one where the finance comes from outside the organization and is generally bifurcated into different categories where first is long-term, being shares, debentures, grants, bank loans; second is short term, being leasing, hire purchase; and the short-term, including bank overdraft, debt factoring.read more and not by the company’s management. Its components are Debt, Common Equity, and Preferred Equity.
The formula of WACCFormula Of WACCThe weighted average cost of capital (WACC) is the average rate of return a company is expected to pay to all shareholders, including debt holders, equity shareholders, and preferred equity shareholders. WACC Formula = [Cost of Equity * % of Equity] + [Cost of Debt * % of Debt * (1-Tax Rate)]read more = (Wd*Kd*(1-tax)) + (We*Ke) + (Wps*Kps).
where,
- Wd = Weight of Debt
- Kd = Cost of Debt
- tax – Tax Rate
- We = Weight of Equity
- Ke = Cost of EquityCost Of EquityCost of equity is the percentage of returns payable by the company to its equity shareholders on their holdings. It is a parameter for the investors to decide whether an investment is rewarding or not; else, they may shift to other opportunities with higher returns.read more
- Wps = Weight of Preferred Shares
- Kps = Cost of Preferred Shares
Question #12 – What is the difference between Trailing PE and Forward PE?
Trailing PE Ratio is calculated using the earnings per share of the past; however, Forward PEForward PEForward PE ratio uses the forecasted earnings per share of the company over the next 12 months for calculating the price-earnings ratio. Forward PE ratio formula = Price per share/Projected earnings per share read more Ratio is calculated using the forecast earnings per share. Please see below an example of Trailing PE vs. forwarding PE Ratio.
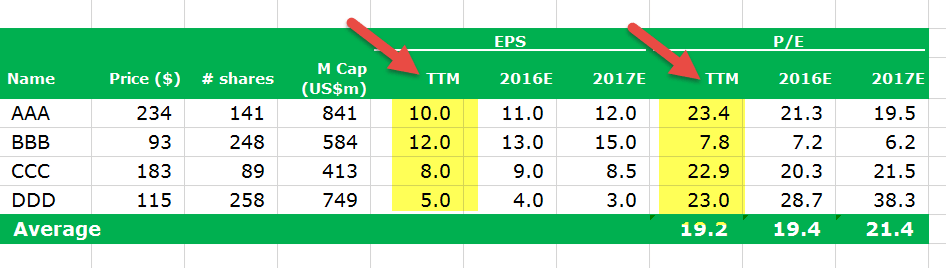
- Trailing Price Earning Ratio formula = $234 / $10 = $23.4x
- Forward Price Earning Ratio formula = $234 / $11 = $21.3x
For more details, have a look at Trailing PE vs. Forward PE
Question #13 – Can Terminal value be Negative?
This is a tricky equity research interview question. Please note that it can happen but only in theory. Please see the formula below for Terminal Value.
If for some reason, WACC is less than the growth rate, then Terminal Value can be negative. High growth companies may get negative terminal values only due to misuse of this formula. Please note that no company can sustain growth at a high pace for an infinite period. The growth rate used here is a steady growth rate that the company can generate over a long period. For more details, please look at this detailed Guide to Terminal valueGuide To Terminal ValueTerminal Value is the value of a project at a stage beyond which it's present value cannot be calculated. This value is the permanent value from there onwards. read more.
Question #14 – If you were a portfolio manager[/wsm-tooltip] with $10 million to invest, how would you do it?
This equity research interview question is asked repetitively.
The ideal way to answer this question is to pick a few good stocks [wsm-tooltip header="Large Cap" description="Large-cap stocks refer to stocks of large companies with value, also known as the market capitalization of 10 billion dollars or more, and these stocks are less risky than others and are stable. They also pay a good dividend and return, and it is the safest option to invest." url="https://www.wallstreetmojo.com/large-cap-stock-companies/"]large capA Portfolio ManagerA portfolio manager is a financial market expert who strategically designs investment portfolios.read more, mid-cap stockMid-cap StockMid-Cap stocks are the stocks of the companies having medium market capitalization. Their capital lies between that of large and small cap companies and valuation of the entire share holdings of these companies range between $2 billion to $8 billion.read more, & small cap, etc.) and pitch the interviewer about the same. You would tell the interviewer that you would invest $10 million in these stocks. You need to know about the key management executives, a few valuation metrics (PE multiples, EV/EBITDA, etc.), and a few operational statistics of these stocks to use the information to support your argument.
Similar types of questions where you would give similar answers are –
- What makes a company attractive to you?
- Pitch me a stock etc.
Question #15 – What PE ratio of a high-tech company is higher than the PE of a mature company?
The basic reason for which the high tech company’s PE is higher is that the high tech company may have higher growth expectations.
- Why is it relevant? Because the expected growth rate is a PE multiplier –
- [{(1 – g)/ROE}/(r – g)]
- Here, g = growth rate; ROE = Return on Equity & r = cost of equity.
It would help if you used a PEG RatioPEG RatioThe PEG ratio compares the P/E ratio of a company to its expected rate of growth. A PEG ratio of 1.0 or lower, on average, indicates that a stock is undervalued. A PEG ratio greater than 1.0 indicates that a stock is overvalued.read more for high-growth companies instead of a PE Ratio.
Question #16 – What is BETA?
This is among the top 5 most expected equity research interview questions. Beta is a historical measure representing a tendency of a stock’s return compared to the change in the market. Beta is usually calculated by using regression analysisRegression AnalysisRegression analysis depicts how dependent variables will change when one or more independent variables change due to factors, and it is used to analyze the relationship between dependent and independent variables. Y = a + bX + E is the formula.read more.
A beta of 1 would represent that a company’s stock would be equally proportionate to the change in the market. A beta of 0.5 means the stock is less volatile than the market. And a beta of 1.5 means the stock is more volatile than the market. Beta is a useful measure, but it’s a historical one. So, beta can’t accurately predict what the future holds. That’s why investors often find unpredictable results using beta as a measure.
Let us now look at Starbucks Beta Trends over the past few years. The beta of Starbucks has decreased over the past five years. This means that Starbucks stocks are less volatile than the stock market. We note that the Beta of Starbucks is at 0.805x.
Question #17 – Between EBIT and EBITDA, which is better?
Another tricky equity research interview question. EBITDA stands forEBITDA Stands ForEBITDA refers to earnings of the business before deducting interest expense, tax expense, depreciation and amortization expenses, and is used to see the actual business earnings and performance-based only from the core operations of the business, as well as to compare the business's performance with that of its competitors.read more Earnings before interest, taxes, depreciation, and amortization. And EBIT stands for Earnings before interest and taxesEBIT Stands For Earnings Before Interest And TaxesEarnings before interest and tax (EBIT) refers to the company's operating profit that is acquired after deducting all the expenses except the interest and tax expenses from the revenue. It denotes the organization's profit from business operations while excluding all taxes and costs of capital.read more. Many companies use EBITDA multiples in their financial statements. The issue with EBITDA is that it considers the depreciation and amortization as they are “non-cash expenses.” So even if EBITDA is used to understand how much a company can earn, it still doesn’t account for the cost of debtThe Cost Of DebtCost of debt is the expected rate of return for the debt holder and is usually calculated as the effective interest rate applicable to a firms liability. It is an integral part of the discounted valuation analysis which calculates the present value of a firm by discounting future cash flows by the expected rate of return to its equity and debt holders.read more and its tax effects.
For the above reasons, even Warren Buffett dislikes EBITDA multiples and never likes companies that use it. According to him, EBITDA can be used where there is no need to spend on “capital expenditure,” but it rarely happens. So every company should use EBIT, not EBITDA. He also gives examples of Microsoft, Wal-Mart & GE, which never use EBITDA.
Question #18 – What are the weaknesses of PE valuation?
This equity research interview question should be very simple to answer. However, there are a few weaknesses of PE valuation, even if PE is an important ratio for investors.
- Firstly, the PE ratio is too simplistic. Just take the current price of the share and then divide it by the company’s recent earnings. But does it take other things into account? No.
- Secondly, PE needs context to be relevant. If you look at only the PE ratio, there is no meaning.
- Thirdly, PE doesn’t take growth/any growth into account. Many investors always take growth into account.
- Fourthly, P (the price of share) doesn’t consider debt. As the market price is not a great measurement of market value, debt is an integral part of it.
Question #19 Let’s say that you run a Donut franchise. You have two options. The first is to increase the price of each of your existing products by 10% (imagining that there is price inelasticity). And the second option would be to increase the total volume by 10% due to a new product. Which one should you do and why?
This equity research interview question is purely based on economics. So you need to think through and then answer the question.
First of all, let’s examine the first option.
- In the first option, the price of each product is increased by 10%. As the price is inelastic, there would be a meager change in the quantity demandedQuantity DemandedQuantity demanded is the quantity of a particular commodity at a particular price. It changes with change in price and does not rely on market equilibrium.read more, even if the price of each product gets increased. So that means it would generate more revenue and better profits.
- The second option is to increase the volume by 10% by introducing a new product. In this case, introducing a new product needs more overhead and production costs. And no one knows how this new product would do. So even if the volume increases, there would be two downsides – one, there would be uncertainty about the sales of the new product, and two, the cost of production would increase.
After examining these two options, the first option would be more profitable for you as a franchise owner of KFC.
Question #20 – How would you analyze a chemical company (chemical company – WHAT?)?
Even if you don’t know anything about this equity research interview question, it’s common sense that chemical companies spend a lot of their money on research & development. So, if one can look at their D/E (Debt/Equity) ratio, it would be easier for the analyst to understand how well the chemical company utilizes its capital. A lower D/E ratio always indicates that the chemical company has strong financial health. Along with D/E, we can also look at Net Profit marginNet Profit MarginNet profit margin is the percentage of net income a company derives from its net sales. It indicates the organization's overall profitability after incurring its interest and tax expenses.read more and P/E ratio.
Recommended Articles
This article has been a guide to Equity Research Interview Questions. Here we provide you with the list of most common techniques and nontechnical equity research interview questions with answers. You may have a look at these other recommended resources to learn more –
- Top Financial Modeling Interview Questions (With Answers)
- Valuation Interview Questions
- Private Equity Interview
- Corporate Finance Interview Questions (with Answers)
Prepare well and give your best shot. All the best for your Equity Research interview!
I myself take interviews of candidates in Technical rounds, hence found your questions upto the mark and even planning to inculcate during next rounds. Kudos to you , for your hard work.
Thanks for your kind words!
I am an investor relation manager but yet still very much benefited from this technical info that you have compiled and shared.
Very grateful and well done!
thanks Michael! glad you liked this one :-)