Skills Required For Equity Research
Equity Research is an important skill in the world of finance and investments. It plays a crucial role in helping investors make informed decisions. Equity research skills are absolutely essential for professionals working in the financial industry, particularly in roles focused on analyzing stocks and making investment recommendations. These skills encompass a range of abilities, including financial analysis, industry research, and market forecasting. Proficiency in financial modeling, valuation techniques, and interpreting financial statements are crucial for conducting in-depth analyses of companies and assessing their investment potential.
This article dives into the most vital aspects of equity research and breaks down the skills you need to succeed.
Strong basic equity research skills enable professionals to stay abreast of market trends, industry developments, and macroeconomic factors that may impact stock performance. By honing these skills, equity research professionals can provide valuable insights to investors, helping them make multiple important decisions and optimize their investment portfolios for long-term success.
The Core responsibilities of equity researchers include:
- Creating financial models
- Writing detailed research reports
- Providing recommendations on investment\
- Monitoring market and industry trends
Key Takeaways
- Mastering equity research is a journey that requires a mix of technical, analytical, and communication skills for successful equity research careers.
- It requires telling the story behind the numbers and influencing billion-dollar decisions.
- Some of the basic skills required include expertise in creating financial models, providing investment recommendations, writing research reports and monitoring industry trends.
Equity Research Skills Explained
Equity research skills are fundamental for professionals engaged in analyzing stocks and providing investment recommendations within the financial industry. These skills involve a diverse range of abilities essential for conducting thorough analyses and making wise investment decisions.
Let us explain to you the main skills required for mastering equity research skills.
- Financial Analysis and Accounting Proficiency: Firstly, proficiency in financial analysis and accounting principles is non-negotiable. Equity research professionals must possess a deep understanding of financial statements, including income statements, balance sheets, and cash flow statements. Analyzing these statements allows analysts to assess the financial health of companies, identify trends, and evaluate key performance indicators crucial for investment decision-making.
- Valuation Techniques: Moreover, strong valuation skills are essential for determining the intrinsic value of stocks. Equity research analysts utilize various valuation methodologies, such as discounted cash flow (DCF) analysis, comparable company analysis (CCA), and precedent transactions analysis, to estimate the fair value of securities. These valuation techniques help analysts assess whether a stock is overvalued, undervalued, or fairly priced in the market.
- Financial Modeling Expertise: Additionally, proficiency in financial modeling is pivotal for equity research professionals. Financial models allow analysts to forecast future financial performance, conduct scenario analysis, and assess the impact of different variables on investment outcomes. Building accurate financial models requires advanced Excel skills and a deep understanding of financial concepts and industry dynamics.
- Report Writing and Communication Skills: Furthermore, effective communication and writing skills are essential for conveying research findings and investment recommendations to clients and stakeholders. Equity research professionals must be able to articulate complex financial concepts in a clear, concise, and persuasive manner through research reports, presentations, and client interactions.
Overall, mastery of these private equity research skills enables professionals to conduct thorough analyses, provide valuable insights to investors, and make investment recommendations that drive positive outcomes in the financial markets.
Top Skills
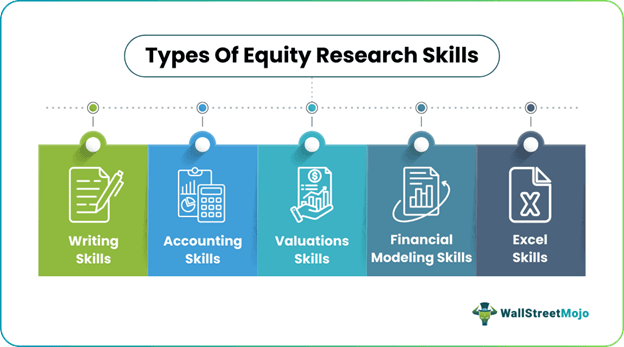
Let us now understand the top five skills with respect to basic equity research through the discussion below.
#5 – Writing Skills
Writing Skills is at number #5. The equity research report is the most important communication from a securities firm to its clients. This report has a particular purpose; i.e., it is intended to help an investor decide on the allocation of resources.
- First thing First – One crucial aspect is that the research report is nowhere close to novels from Dan Brown, wherein the best is saved for the last!. In a research report, the stock target and price recommendations come first.
- KISS Principle – “Keep it Simple Silly” is the golden rule. It is essential to be to the point and precise.
- Less is More – Another essential aspect is that you are not required to write a full Ph.D. thesis here; a single-page note or a couple of reports would be great. Readers hardly have 1-2 minutes to read your full report. They may not even scan till the 2nd page.
#4 – Accounting Skills (More than Numbers!)
Number#4 is Accounting! Accounting here is not about Debits and Credits. It is much more than that.
- Be proficient in Financial Statement Analysis – The keyword here is Financial Statement Analysis. You are expected to be proficient in vertical analysis, horizontal analysis, ratio analysis, cash conversion cycles, ROEs, ROCEs, etc.
- Sourcing of Right Data – Another aspect where I see many challenges is sourcing the right data. For example, if you require an Annual Report of a company, would you visit the company’s website or the SEC website. Besides, which other documents will you refer to draw your conclusions? Typical key sources to look for information are Press Releases, Conference Calls, SEC Filings, etc. Financial Statement Analysis done on the wrong set of numbers will lead to results that will mislead the analysis. Hence, as an analyst, the primary challenge is to fetch the correct data.
- “Identify the Shenanigans” – Our main focus in analyst specific accounting is to identify and predict the accounting malpractices by companies. These are normally hidden away. You can see below the confessions in the Satyam Fraud Case.
#3 – Valuations (Lies in the eyes of the beholder!)
Valuation Skills is at Number #3. Equity Valuation is estimating the potential market value of a financial asset or liability. Valuations are required in many contexts, including investment analysis, capital budgeting, merger and acquisition transactions, financial reporting, taxable events to determine the proper tax liability, and litigation. You should be aware of the following –
- Intrinsic Valuation methods – Intrinsic Valuation Method (DCF) which means primarily determines the value by estimating the expected future earnings from owning the asset discounted to their present value.
- Extrinsic Valuation Method – Relative value models determine the value based on the market prices of similar assets. It includes valuation ratios like PE Ratio, P/CF, P/BV, and many more.
- The Key is to identify the right valuation methodology – There are more than 15 valuations approaches, including DCF, Enterprise Valuation Methods, and Equity Valuation Methods. The vital thing to know is why a particular valuation Methodology is used in a specific sector. For example, Banks are valued using Price/Book Value; however, other sectors may not use Price/Book Value as a key valuation metric.
#2 – Financial Modeling (Cliffhanger!)
At number #2 is Financial Modeling. Financial modeling means forecasting the future of the company or an asset using an Excel Model that is easy to understand and perform scenario analysis. In the context of our discussion here, Excel-based Financial Modeling includes professionally forecasting future financial statements like Income Statements, Balance Sheets & Cash Flows. Unfortunately, every other subject is taught during graduation and post-graduation except Financial Modeling and Excel.
- Financial Modeling follows the Modular Approach – The primary approach taken is the Modular one. The modular approach essentially means that we build core statements like Income statements, Balance Sheet, and Cash Flows using different modules/schedules.
- Provide Additional Schedules for clarity – The different schedules are the depreciation schedule, working capital schedule, intangibles schedule, shareholder’s equity schedule, other long term items schedule, debt schedule, etc. The different schedules are linked to the core statements upon their completion.
- Free Financial Modeling Training – If you want to learn Financial Modeling from the ground up, you can refer to the excellent Financial Modeling Course we offer. Please note that Financial Modeling skills may not be very easy to acquire. It requires time and patience to master this skill set.
#1 – Excel Skills (Most Obvious is Most Dangerous!)
At number #1 is the Microsoft Excel Skills! I am obviously not joking. Equity Research Analyst spend around 10-12-14-16 hours each day working on excel doing financial modeling, valuations, and financial statement analysis. Important points to note in Excel are
- Formatting is most important – An analyst needs to produce an error-free and neat output. There is a lot of money riding on the research reports published by the analysts and the last thing one needs is to lose a client due to loosely formatted tables and excel models.
- Speed & Accuracy – Timely delivery of reports and models is required in the Equity Research Industry. MS Excel is the only place I can say where there are “Shortcuts to Success”! I have hardly seen research using a mouse, and most of them are masters in Excel.
- Analysis – One should use Excel tools like Pivot, Filter, Sort, VLOOKUP in Excel, HLOOKUP Function, etc. to analyze complex data and client requests.
- Scenario Building – It is important to create different scenarios for Modeling like Optimistic, Pessimistic, and Most expected. Also, your client may want to change a few assumptions to see how they affect the target price find terminal value, capm beta, etc. Hence, you need to be well aware of Data Tables, Goal Seek in Excel, etc. to provide these features to your clients.
- Graphs & Charts – A picture speaks more than a thousand words! The majority of the research reports contain neat and informative investment banking graphs and charts and less written material. You should try and master this data representation technique.
Equity Research Vs Investment Banking
Let us understand the distinctions between basic equity research skills and investment banking through the comparative points below.
Equity Research
- Equity research involves analyzing individual stocks and industries to assess their investment potential.
- Equity researchers take a deep look into financial statements, market trends, and industry dynamics to provide insights into the performance and prospects of specific companies.
- They often utilize financial modeling and valuation techniques to estimate the fair value of stocks and make investment recommendations to clients.
- Equity researchers interact closely with investors, asset managers, and other clients to communicate their research findings and provide actionable insights for investment decision-making.
Investment Banking
- Investment banking includes a broad range of financial services, primarily focused on facilitating capital raising, mergers and acquisitions (M&A), and other corporate transactions.
- Investment bankers advise corporations, governments, and institutional clients on strategic matters such as mergers, acquisitions, divestitures, and fundraising activities.
- They play a crucial role in underwriting securities offerings, structuring deals, negotiating transactions, and providing financial advisory services.
- Investment bankers interact closely with corporate executives, institutional investors, private equity firms, and other stakeholders to execute complex financial transactions and help clients achieve their strategic objectives.
Frequently Asked Questions (FAQs)
What are the most important tools used in equity research?
The most commonly used tools include Excel, FactSet, Capital IQ, and Python for data analysis are some of the most popular tools used which you need to master.
How long does it take to gain expertise in equity research?
It typically takes 2-5 years of focused experience or study to become proficient, moving from an associate to a fully-fledged analyst. Certifications like CFA can help accelerate the growth. However, individuals may progress sooner when they have a sharp aptitude, analytical skills, and eagerness to learn.
What are the two categories of equity research?
Equity research is typically divided into two main categories. They are Buy-Side and Sell-Side.
Sell-side equity research jobs are for analysts working for brokerage firms or investment banks. They write research reports on publicly traded companies, which are shared with the firm’s clients like mutual funds and individual investors.
Buy-side research is performed by analysts working for mutual funds, hedge funds, and insurance companies. Their research is not shared with the public.
Recommended Articles
This article has been a guide to Equity Research Skills. Here, we explain the top tangible skillsets that one should acquire, like report writing and accounting. Let me know what you think. Many thanks, and take care. Happy Learning!