What is Price to Book Value?
Price to Book Value Ratio or P/B Ratio is one of the most important ratios used for Relative Valuations. It is usually used along with other valuation tools like PE Ratio, PCF, EV/EBITDA, etc. It is most applicable for identifying stock opportunities in Financial companies, especially Banks. The price to book value ratio is one of the relative valuation tools used to measure stock valuation.
A good price to book value ratio according to value investors is less than 1.0. On the other hand, a high ratio implies that the company’s market value is significantly higher than its accounting value. Investors would want the management to create more value for the stock to become more attractive for investors.
Price To Book Value Explained
Price to book value is a metric closely followed by investors to find a company’s market capital in comparison to its book value. Investors look to find low price to book value stocks to make greater gains.
This metric helps the investor to understand if the market value of the company is higher than its book value or otherwise. This in turn becomes a deciding factor in terms of buying the stock or not. Because stocks with price to book value greater than 1.0 indicates that the market value of the company is significantly higher than its accounting or book value.
Moreover, this also helps with companies close to bankrupcy or liquidation as investors are compensated based on the book value and not the market values in scenarios of this nature.
It is also important to note that manufacturing companies or any company with tangible assets like machinery, plants, properties, etc. have a meaningful book value. However, companies with intangible assets like employees, office space, etc. have a less relevance in terms of book value.
Formula
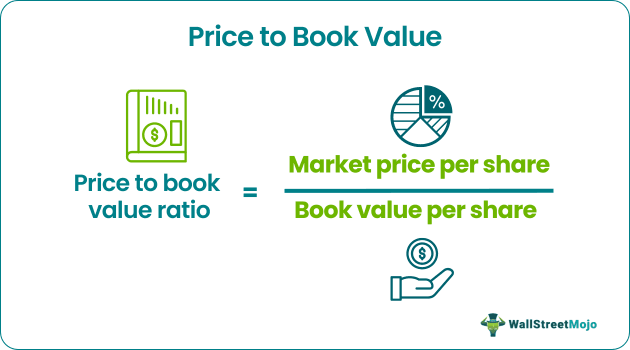
Price to Book Value Ratio = Price Per Share / Book Value Per Share
Please note that Book value = Shareholder’s Equity = Net Worth.
If this ratio of the stock is 5x, this implies that the share’s current market price is trading at five times the book value (as obtained from the balance sheet).
How To Calculate?
Let us now understand the steps involved in the calculation of price to book value ratio through the discussion below and example.
Let us apply the Price to Book Value formula to calculate Citigroup’s P/B Ratio. First, we require Citigroup’s Balance sheet details. You may download Citigroup’s 10K report from here.
The below table shows the Consolidated Shareholder’s equity section found on Page 133
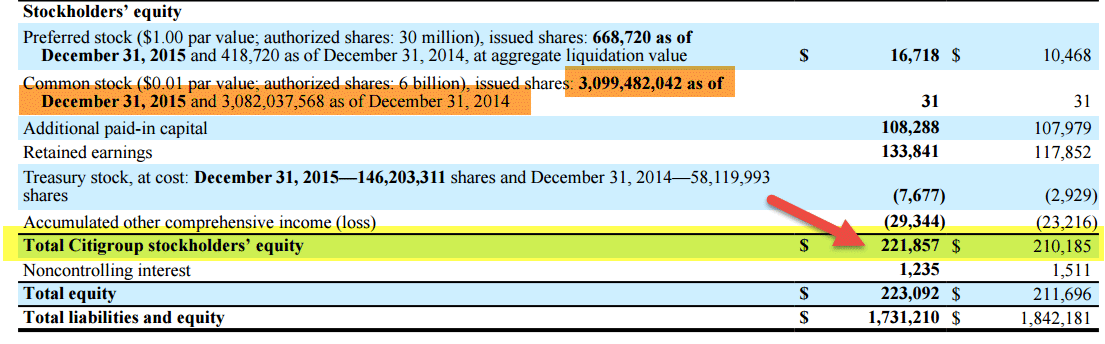
From the table above, Citigroup’s shareholders’ equity was $221,857 million in 2015 and $210,185 million in 2014.
Corresponding common stock outstanding numbers are 3,099.48 million shares in 2015 and 3,083.037 million in 2014.
Citigroup’s Book value in 2015 = $221,857 / 3099.48 = 71.57
Citigroup’s Book value in 2014 = $210,185 / 3,083.037 = 68.174
Price of Citigroup as of 4th march, 2016 was $42.83
Citigroup P/BV 2014 = $42.83/71.57 = 0.5983x
Citigroup P/BV 2015 = $42.83/68.174 = 0.6282x
Also, note that Assets = Liabilities + Shareholder’s Equity (Simple accounting equation)
Shareholder’s Equity or Book Value = Assets – Liabilities.
If you wish to brush up on your accounting basics, you can look at this Basic Accounting Tutorial.
In the case of Citigroup, we could have also used an alternated formula, as provided above.
Examples
Let us understand the concept better to learn how to spot low price to book value stocks with the help of a few examples sector-wise.
Example #1- Software Companies
In this section, we see how the P/B Ratio of Software companies is calculated and whether it makes sense for us to apply the P/B ratio for valuing Software companies. The case study under consideration here is Microsoft.
Please download Microsoft 10K Report for Balance Sheet Details as to the first step.
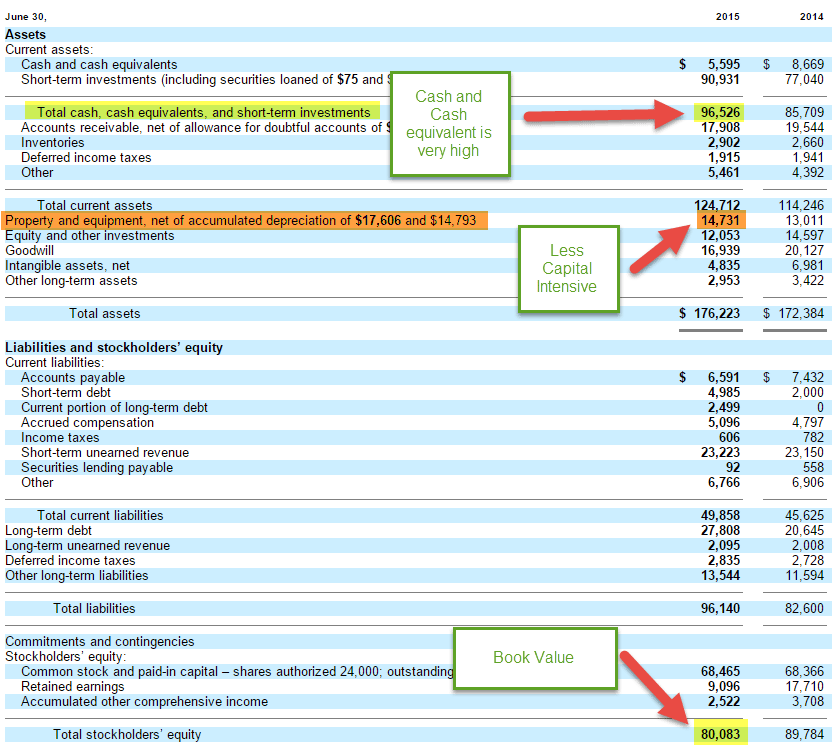
Key Observation of Microsoft Balance Sheet (in the context of Book Value)
- Microsoft has a high amount of Cash and Cash Equivalents.
- Microsoft Property plant and equipment is less than 10% of the total assets.
- Its inventory is low as compared to Asset Size.
- Goodwill and Intangible Assets are greater than Tangible Assets.
With a general understanding of a Software company’s balance sheet, let us now look at the Historical P/B Ratio of some of the Internet/Software companies.
The below graph shows a quick comparison of the Historical Book values of Microsoft, Google, Citrix, and Facebook.
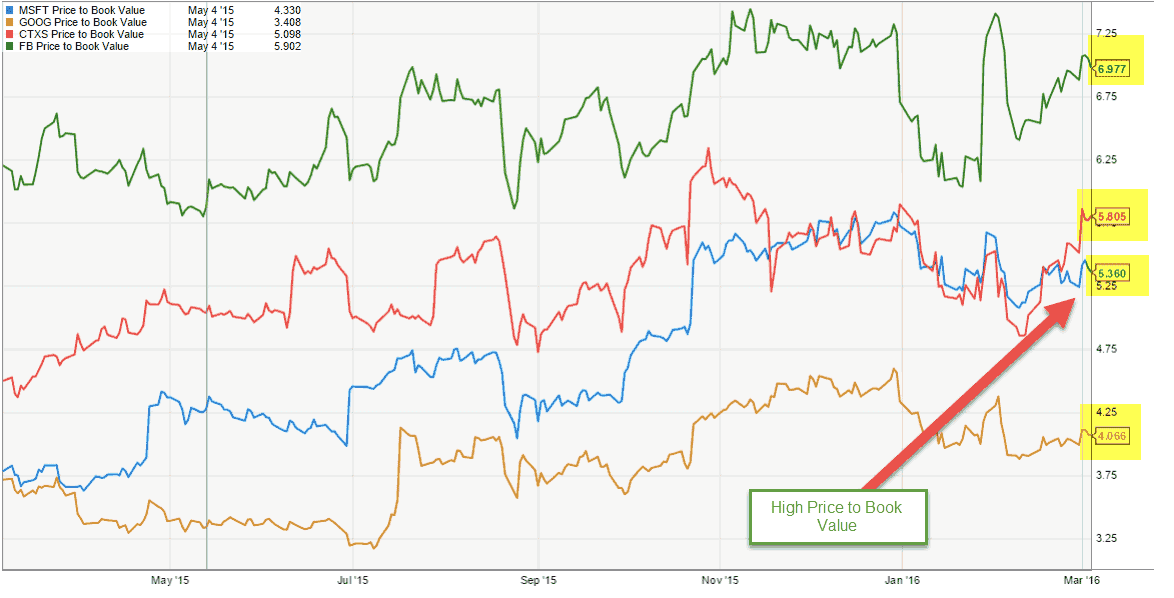
source: ycharts
Key Observations
- It can be noted that the P/B ratio is generally higher for software companies. We note that for the above companies, the price to book value ratio is higher than 4-5x.
- The primary reason for the higher P/B Ratio is low tangible assets compared to the total assets.
- The value derived from the above may not be the correct number to look at. internet and software companies have a higher amount of intangible assets, and therefore, the Book
- (as seen in the Microsoft Balance Sheet)
- Please note that due to this reason, we do not use the Price Book Value ratio as a valuation ratio for companies that have a low amount of tangible assets.
- Additionally, in most cases, these companies are high-growth companies where we can apply alternate measures like PE or PEG ratio to incorporate growth during valuations.
Other sectors where you will find a higher Price to Book value ratio and CAN NOT apply P/B Ratio.
- Internet Companies like Amazon, JD.com, Google, Alibaba, eBay
- FMCG Companies like Colgate, P&G, Walmart, Cadbury, Coca-cola
Example #2-Automobile Companies
As noted above, the P/B ratio is not the right valuation multiple for Internet Companies. In this section, let us evaluate if it makes sense for automobile companies or not. First, we take the example of General Motors.
You can download the General Motors 10K report from here.
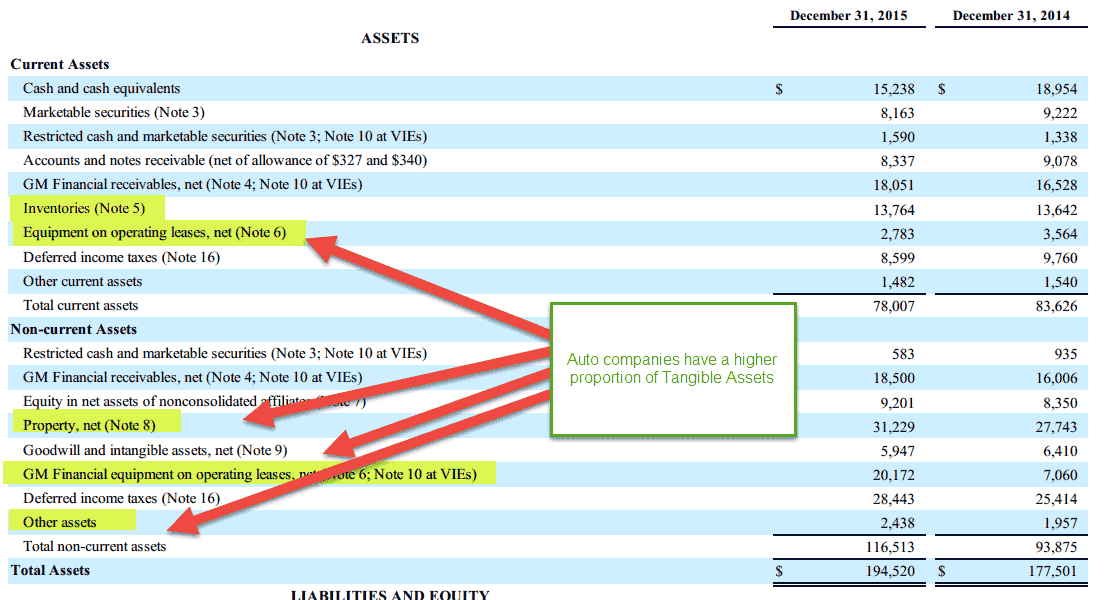
Key Observation on General Motors Balance Sheet
- General Motors have a higher proportion of Tangible Assets as a % of total assets (more than 30%)
- General Motors’ assets include Inventories, Capital and Operating Leases, and Other Assets.
- Intangible Assets are much lower (less than 3% of the total asset size)
- Since the balance sheet contains a higher proportion of tangible assets, we can apply the Price to Book value ratio as a valuation proxy.
The below graph shows a quick comparison of the Historical Book values of General Motors, Ford, Toyota Motors, and Nissan.
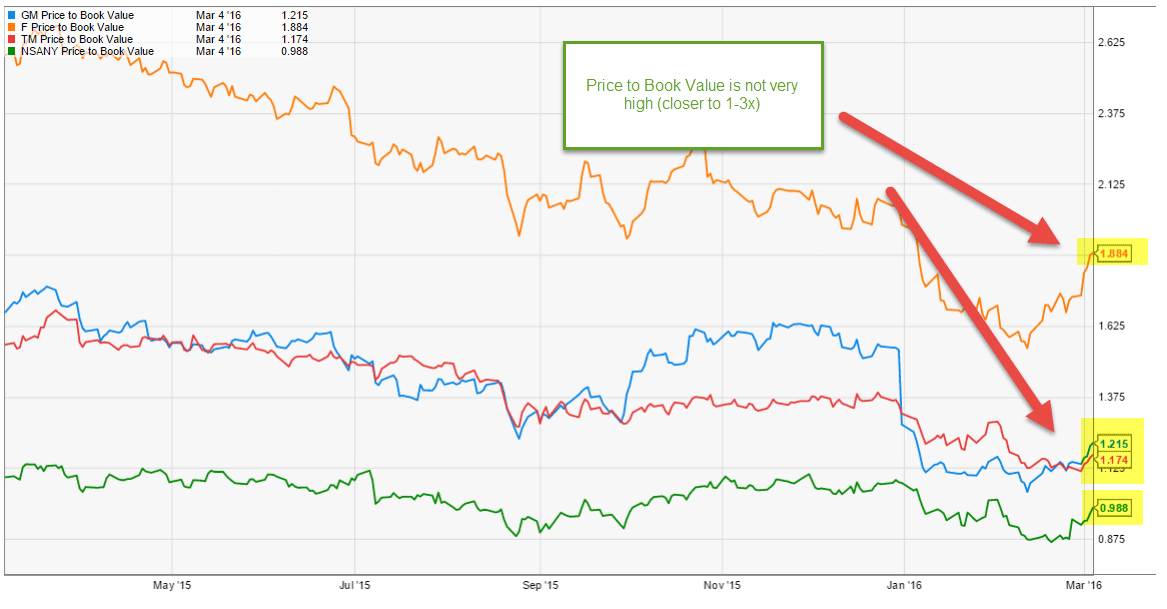
source: ycharts
Key Highlights of Price to book value ratio of Automobile Companies
Automobile companies generally have a Price to Book value ratio greater than 1.0x.
This normally happens because their asset book value underestimates their replacement value.
Even though we can apply a P/B ratio as a proxy for the automobile company’s valuation, it is still noted as the primary valuation tool for such capital-intensive sectors. However, some analysts may consider this in the comparable comp table.
Other capital-intensive sectors where PB can be used as a proxy valuation tool.
- Industrial Firms like Siemens, General Electric, BASF, Bosch, etc
- Oil and Gas Companies like PetroChina, Sinopec, Exxon Mobil, Royal Dutch Shell, BP, etc.
Example #3- Banking
We have noted that P/B ratios cannot be applied to Internet and software companies from the above. However, we can still use these ratios for capital-intensive proxy companies like automobiles and Oil & Gas. So let us now look at if the price to book value makes sense for Financial Sectors.
Let us look at the Balance Sheet of Citigroup. You may download Citigroup’s 10K report from here.
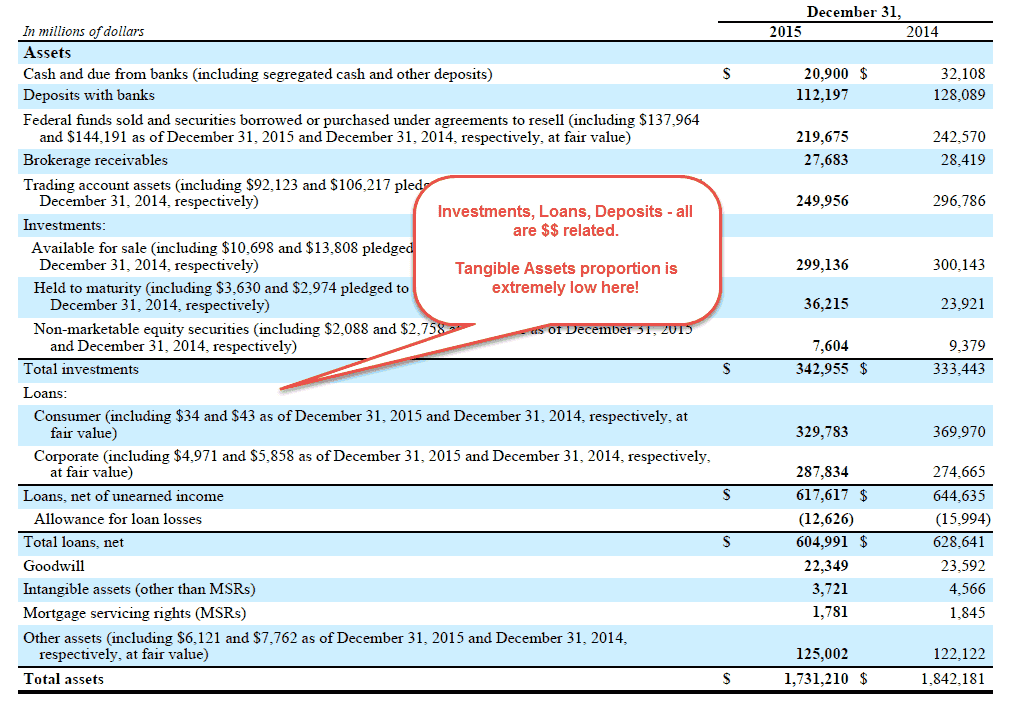
Key Observation of Citigroup’s Balance Sheet
- Banks have assets and liabilities that are periodically marked to market, as they are mandatory under regulations. So, the Balance Sheet value represents the market value, unlike other industries where the Balance Sheet represents the historical cost of the assets/liabilities.
- Bank assets include investments in government bonds, high-grade corporate bonds or municipal bonds, and commercial, mortgage, or personal loans that are generally expected to be collectible.
The below graph shows a quick comparison of the Historical Book values of JPMorgan, UBS, Citigroup, and Morgan Stanley.
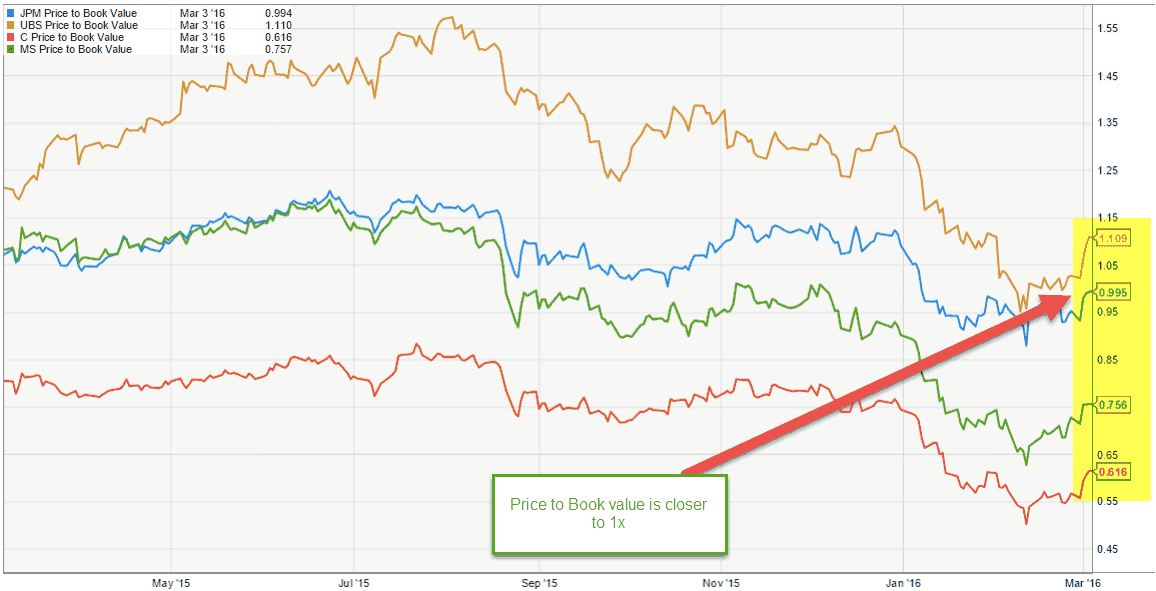
source: ycharts
Why Price Book Value ratio can be used to value Banking Stocks
- Since Banking Assets and Liabilities are periodically marked to market, their assets and liabilities represent the fair or the market value. Hence, the P/B ratio can be used for valuing Banking Stocks.
- Under ideal conditions, the price/book value (P/BV) ratio should be close to 1, though it would not be surprising to find a P/BV ratio of less than one for a bank with a large amount of Non Performing Assets.
- It is also possible to find a P/BV ratio above 1 for a bank with significant growth opportunities due to its location because it is a desirable merger candidate or because of its use of technology in banking.
Limitations
Let us understand the limitations of deriving the price to book value ratio through the discussion below.
- Book value only takes into consideration the tangible value of the firm. Intangible economic assets like human capital are not considered in the P/B ratio.
- The effect of technology upgrades, Intellectual Property, Inflation, etc., can cause the book and market values of assets to differ significantly.
- Accounting Policies adopted by the management can significantly impact the Book Value. For example, the Straight-line method vs. Accelerated depreciation method can drastically change the Net Property Plant and equipment value.
- Additionally, the Business model can also lead to differences in Book Value. A company that outsources production will have a lower book value of assets than a company that produces goods in-house.
Historical P/B ratio vs. Forward P/B
Like the Trailing PE and the Forward PE, we can have a similar formula for Price to Book Value ratio.
Historical P/B = Current Price / Book Value (historical)
Forward P/B = Current Price / Book Value (Forward, forecast)
The price to book value of history is relatively straightforward to find out from the balance sheet. However, the forward Book Values might get slightly tricky.
There are two things that you can do to obtain the book value –
- The easier (and expensive) way is to access Factiva or Bloomberg, where we get such data in an easily downloadable format. You need to provide the ticker and download the consensus book to the value forecast.
- The difficult one is to prepare the financial model and project Balance Sheet of the company under consideration. It involves preparing a full three statement financial model. If you want to learn more about Financial modeling from scratch, you can take this Financial modeling in Excel.
Let us take an example of how we can incorporate Trailing and Forward Price to Book Value ratios to identify the cheapest and most expensive stock from the consideration set.
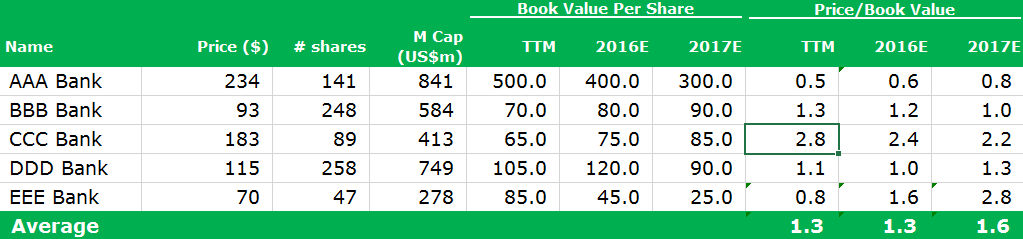
Calculate the historical PB and Forward PB
AAA Bank, Historical Book Value is $500.0, and its Current Market Price is $234.
Trailing P/B Ratio = $234 / $500 = 0.5x
Likewise, we can calculate the Forward Price to Book Value ratio of AAA Bank. AAA 2016 estimated Book Value is $400.0, and its current price is $234.
Forward P/B Ratio = $234 / $400 = $0.6x
Some of the things to consider regarding the Historical and Forward Price to Book Value Ratio
- If Book Value is expected to increase, the Forward P/B ratio will be lower than the Historical Ratios. We can observe this in the case of BBB Bank and CCC Bank, where the Book Value forecast increased in 2016 and 2017.
- However, if Book Value is expected to show a decline in the future, you will note that the Forward P/B ratio will be higher than the Historical P/B Ratio. This can be observed in Bank AAA and Bank EEE, where the Book value declines.
- There can also be a case where book value does not show any trend, for example, in Bank DDD, where Book value increases in 2016 and thereby decreases in 2017. We will not see any particular trend in the Price to Book Value Ratio in such cases.
How to use Price to Book Ratio for valuations?
Let us start with the table that we have above. Assuming that this comparable comp lists relevant competition and important financial numbers like Price, Market Cap, Book value, etc.
Can you guess which is the cheapest and the most expensive bank from the above table?
Hint – Take both the Historical P/B Ratio and Forward P/B Ratio into consideration.
Which is the cheapest bank?
- The cheapest bank from the table provided is AAA Bank. Its Historical Price to Book Value ratio is 0.5x, and the forecast is 0.6x and 0.7x in 2016 and 2017
- However, I feel there is a catch here. The book value declines each year, and the forward P/B ratio may increase further. The declining book value can be due to limited growth opportunities or forecasted losses.
- Bank BBB may be a safe bet, given its Book value is growing, and its P/B ratio is closer to 1x in the future.
Which is the Most Expensive bank?
- There can be two banks under consideration for the most expensive bank – Bank CCC and Bank EEE.
- Looking at the book value numbers of EEE, it seems that they are experiencing losses each year, thereby leading to a decrease in book value.
- However, Bank CCC shows an increase in book value in future years, thereby making it a safer bet.
- I think I will refrain from Bank EEE compared to Bank CCC due to the reasons above.
Relationship between P/B Ratio and ROE
The price to book value ratio is closely related to the ROE of the company.
(Price/Book Value Per share) = (Price/EPS) x (EPS/Book Value Per share)
Now, Price/EPS is nothing but a PE ratio.
EPS/Book value per share formula is ROE (remember, ROE = Net Income / Shareholder’s Equity or Book Value)
Because of its close linkage to return on equity (Price to book is PE multiplied by ROE), it is useful to view price to book value together with ROE.
- General Rule of Thumb
- Overvalued: Low ROE + High P/BV Ratio
- Undervalued: High ROE + Low P/BV Ratio
It applies to those industries that need to revalue their balance sheet assets every year. Used in valuing Financials, especially banks, which squeeze a small spread from a large base of assets (loans) and multiply that spread by utilizing high levels of leverage (deposits).
Recommended Articles
This article is a guide to Price to Book Value Ratio & what is it. Here we discuss its formula, how to calculate, example, limitations. You may also have a look at the following articles –