Financial Analysis Examples
An example of Financial analysis is analyzing a company’s performance and trend by calculating financial ratios like profitability ratios, including net profit ratio, which is calculated by net profit divided by sales. It indicates the company’s profitability by which we can assess the company’s profitability and trend of profit. There are more liquidity ratios, turnover ratios, and solvency ratios.
Financial Statement Analysis is considered one of the best ways to analyze the fundamental aspects. It helps us understand the company’s financial performance derived from its financial statements. It is an important metric to analyze its operating profitability, liquidity, leverage, etc. The following financial analysis example outlines the most common financial analysis used by professionals.
- Financial analysis involves calculating ratios to estimate a company’s performance and trends.
- Financial ratio examples portray crucial tools that finance professionals use to evaluate the relative performance of two or more companies in the same industry.
- One example is the net profit ratio, calculated by dividing net profit by sales. This ratio provides insight into the company’s profitability and profit trend. Other important ratios include liquidity, turnover, and solvency ratios.
- By analyzing financial ratios, investors, analysts, and other stakeholders can gain valuable insights into a company’s strengths and weaknesses and make informed decisions about investing or doing business with the company.
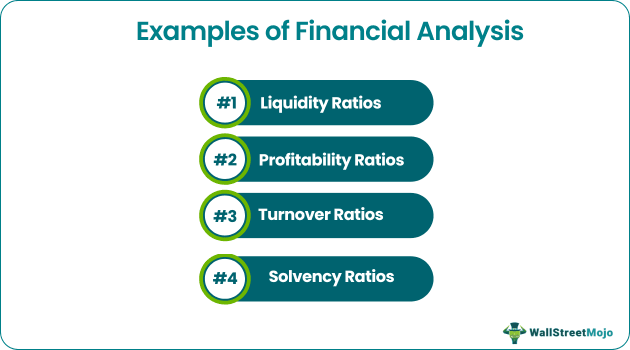
Top 4 Financial Statement Analysis Examples
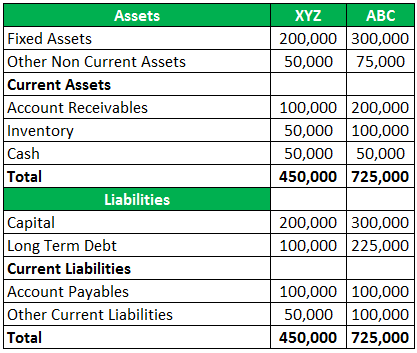
Below mentioned are the financial statements of XYZ Ltd & ABC Ltd.
Balance Sheet of XYZ Ltd. & ABC Ltd.
P&L Statement of XYZ Ltd. & ABC Ltd.

Below mentioned are the examples of financial ratio analysis based on financial statements provided above:
Example #1 – Liquidity Ratios
Liquidity ratios measure the ability of a company to pay off its current obligations. The most common types are:
Current Ratio
The Current Ratio measures the number of current assets to current liabilities. Generally, the ratio of 1 is considered ideal for depicting that the company has sufficient current assets to repay its current liabilities.
Current Ratio = Current Assets / Current Liabilities
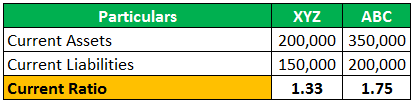
ABC’s Current Ratio is better than XYZ, which shows ABC is in a better position to repay its current obligations.
Quick Ratio
The Quick ratio helps analyze the company’s instant paying ability of its current obligations.
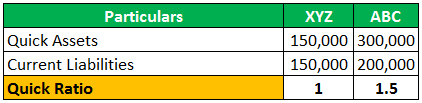
ABC is better positioned than XYZ to cover its current obligations instantly.
Example #2 – Profitability Ratios
Profitability ratios analyze the earning ability of the company. It also helps in understanding the company’s operating efficiency of the business. A few important profitability ratios are as follows:
Operating Profitability Ratio
Measures the Operating efficiency of the company;
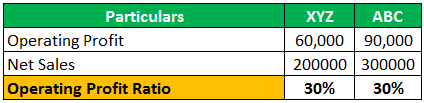
Both companies have a similar operating ratio.
Net Profit Ratio
Measures the overall profitability of the company;
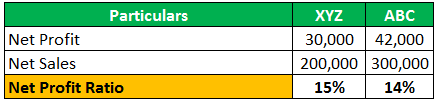
XYZ has better profitability compared to ABC.
Return on Equity (ROE)
Return on Equity measures the return realized from shareholders’ equity of the company.
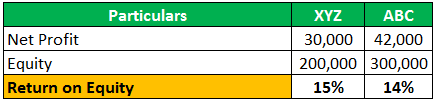
XYZ provides a better return to its equity holders as compared to ABC.
Return on Capital Employed (ROCE)
Return on Capital Employed measures the return realized from the total capital employed in the business.

Both companies have a similar return ratio to be provided to all the owners of capital.
Example #3 – Turnover Ratios
Turnover ratios analyze how efficiently the company has utilized its assets.
Some important turnover ratios are as follows:
Inventory Turnover Ratio
Inventory Turnover Ratio measures evaluating the effective level of managing the business’s inventory.
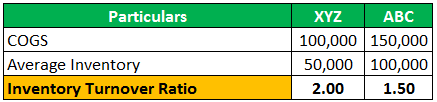
A higher ratio means a company is selling goods quickly and managing its inventory level effectively.
Receivable Turnover Ratios
Receivable Turnover Ratios help measure a company’s effectiveness in collecting its receivables or debts.
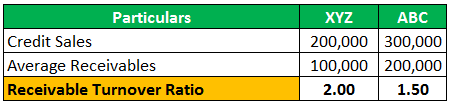
A higher ratio means the company is collecting its debt more quickly and managing its account receivables effectively.
Payable Turnover Ratios
The payable Turnover Ratio helps quantify the rate at which a company can pay off its suppliers.
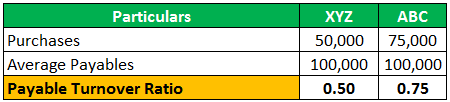
Higher the ratio means a company is paying its bills more quickly and managing its payables more effectively.
Example #4 – Solvency Ratios
Solvency ratios measure the extent of the number of assets owned by the company to cover its future obligations. Some important solvency ratios are as follows:
Debt Equity Ratio
The Debt to Equity Ratio measures the amount of equity available with the company to pay off its debt obligations. A higher ratio represents the company’s unwillingness to pay off its obligations. Therefore it is better to maintain the right debt-equity ratio to manage the company’s solvency.
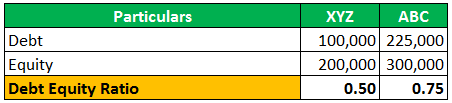
A higher ratio means higher leverage. XYZ is in a better solvency position as compared to ABC.
Financial Leverage
Financial leverage measures the number of assets available to equity holders of the company. The higher the ratio, the higher the financial risk in terms of debt position to finance the company’s assets.
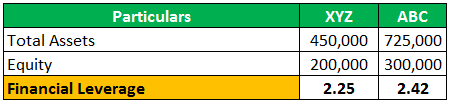
Higher the ratio of ABC implies that the company is highly leveraged and could face difficulty paying off its debt compared to XYZ.
Conclusion
It is important to understand that financial ratios are one of the most important metrics used by finance professionals in analyzing the financial performance of companies. Also, it helps in understanding the relative performance of two or more companies in the same industry.
Frequently Asked Questions (FAQs)
1. What is trend analysis in financial analysis?
Trend analysis is a type of financial analysis that involves comparing a company’s financial data over multiple periods to identify trends and patterns. For example, this type of analysis helps to identify whether the company’s financial performance is improving or declining over time.
2. What is cash flow analysis in financial analysis?
Cash flow analysis is a type of financial analysis that involves examining a company’s cash inflows and outflows to assess its ability to generate cash and meet its financial obligations. This analysis helps identify whether the company generates sufficient cash to fund its operations and investments.
3. What is sensitivity analysis in financial analysis?
Sensitivity analysis is a type of financial analysis that involves examining the impact of changes in key assumptions on a company’s financial performance. This type of analysis helps to identify the most important drivers of the company’s financial performance and the potential risks and opportunities associated with these drivers.
Recommended Articles
This article has been a guide to Examples of Financial Analysis. Here we discuss the top 4 Financial Analysis Examples, including profitability, liquidity, turnover, and solvency ratios. You can learn more about financing from the following articles –