Formula to Calculate Average Inventory
The average Inventory Formula is used to calculate the mean value of Inventory at a certain point in time by taking the average of the Inventory at the beginning and the end of the accounting period. It helps management understand the Inventory the business needs to hold during its daily course of business.
Since Ending Inventory can be impacted by a sudden drawdown of Inventory or a large supply of Inventory, Average takes care of such spikes as it takes the mean value of both the Beginning and Ending Inventory.
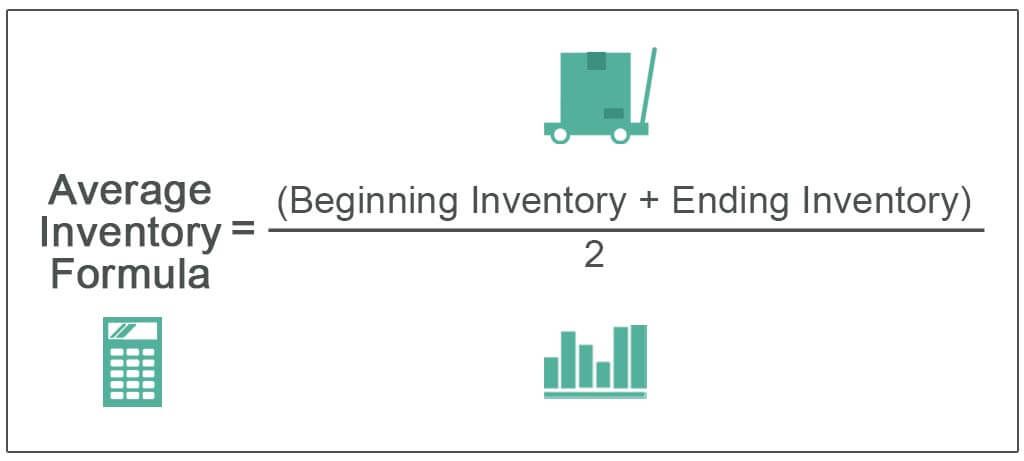
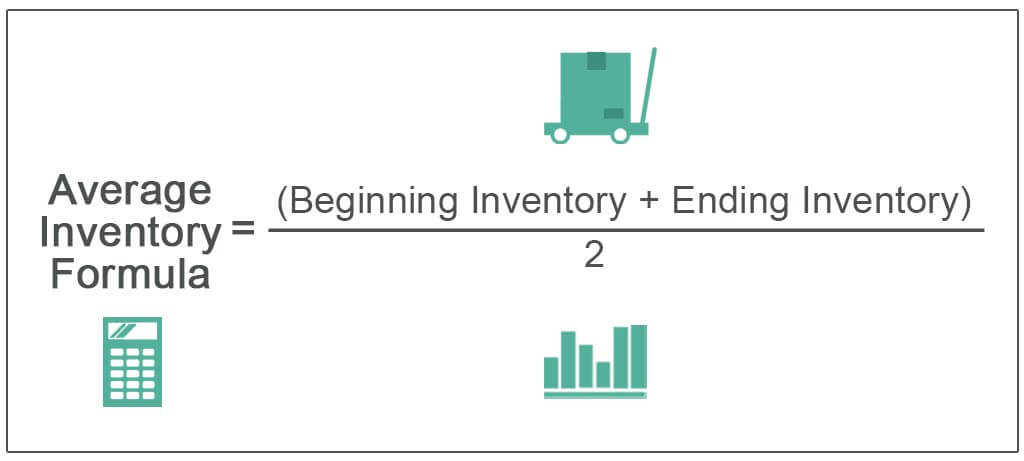
Average Inventory = (Beginning Inventory + Ending Inventory) / 2
The above formula is one of the simplest ways to calculate the Average Inventory, which is used to avoid the effect of sharp spikes or drops in the Ending Inventory as it involves taking the Average of Beginning and Ending Inventory.
Inventory is the driving force behind the ability of a business to generate revenues and resulting profit, and managing Inventory cost-effectively helps the business optimize its profits. It acts as a comparison tool and helps in analyzing overall Revenue generated by the business from the context of Inventory utilization (Holding Inventory for a long also results in a cost for the business in the form of storage cost, labor cost and also the business carries the risk arising on account of Inventory becoming obsolete, rotted, etc.)
Key Takeaways
- The average inventory formula calculates the mean inventory value during a specific period by considering the inventory levels at the beginning and end of that period.
- This calculation enhances management’s understanding of the necessary inventory required for seamless daily operations.
- Inventory analysis plays a pivotal role in determining the optimal inventory quantity needed to facilitate sales activities.
- This involves utilizing the average of both initial and closing inventory levels, a logical approach for evaluating sales performance.
- Overreliance on average inventory as a planning tool in the woolen industry can potentially result in either missed sales opportunities or an excessive inventory burden.
Example (with Excel Template)
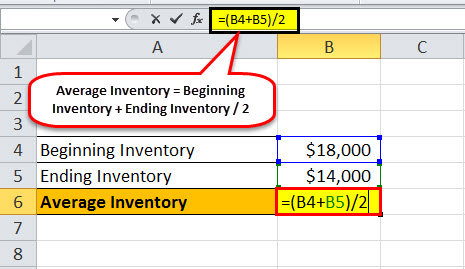
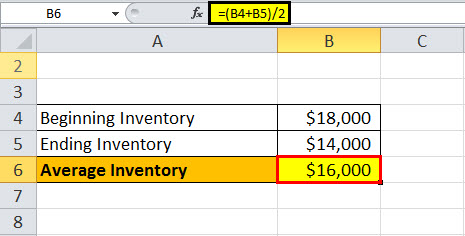
ABC Limited reported the following details on its Inventory levels as on 31.03.2018.
| Beginning Inventory | $18,000 |
| Ending Inventory | $14,000 |
| Average Inventory | ? |
Avg Inventory-
As inventory management becomes more efficient across supply chains, end consumers increasingly benefit from faster fulfillment options. Services like Shipt now enable same-day grocery delivery, reflecting how real-time inventory systems support timely access to everyday essentials without requiring a trip to the store.
Use and Relevance
Inventory Analysis helps management understand its Purchase pattern and Sales trend, which helps them in better planning of Inventory to avoid the problem of stock-outs and avoid the cost of carrying excess Inventory as that can strain the company’s finances. Further. It helps in the computation of various useful ratios, namely:
#1 – Inventory Turnover Ratio
One of the important ratios uses Avg Inventory to understand how fast a company sells its Inventory, whereby a higher ratio implies either strong sales or insufficient Inventory resulting in loss of business, and a lower ratio implies weak sales, excess Inventory, or lack of demand for the company’s product.
Inventory Turnover Ratio= (Cost of Goods Sold/Avg Inventory)
Example of Inventory Turnover Ratio
Continuing with the above-given example, let’s assume ABC Limited made a $200000 in Sales and $128000 in Cost of goods sold (COGS). Using the data, we can compute the Inventory Turnover Ratio as follows:
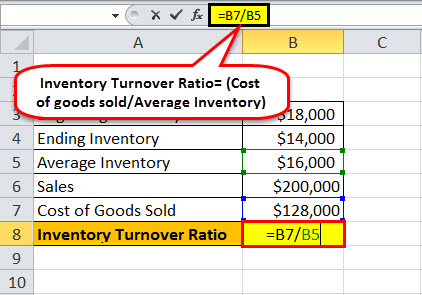
= ($128000/$16000) = 8
#2 – Avg. Inventory Period
Another important ratio uses the Inventory Turnover Ratio, which allows management to understand the time to convert goods into sales.
Avg Inventory Period = (Number of Days in Period/Inventory Turnover Ratio)
Example of Avg Inventory Period
Continuing with an above-given example where ABC limited has an Inventory Turnover Ratio of 8 times. Using the data and assuming 365 days, we can calculate the avg Inventory Period as follows:
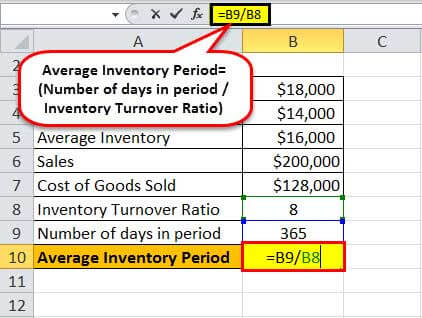
= (365/8) = 45.63
Issues with Average Inventory Formula
- One of the major issues is that it’s calculated based on the Ending Inventory Balance of the period, which may not be a true representative of the period’s average.
- Any Inventory planning based on Avg Inventory will result in loss of sales during peak season time and excess Inventory during the non-peak period. It is not a good estimation tool for businesses, which is seasonal as their seasonal shifts impact their sales. Examples include companies in the Woolen Industry etc.
- The majority of the business provides an estimate of the Ending Inventory instead of making an exact Inventory count, which again affects the calculation of Average Inventory, which itself is based on the Mean of Beginning and Ending Inventory.
Final Thoughts
- Inventory helps analyze how much Inventory Investment is required to support a given level of sales for the business. It is used to measure the amount of Inventory that a business usually holds over a longer time frame. It is simply the average between the Inventory level reported during the Beginning of the measurement period and the end of the measurement period. It holds relevance as the Income Statement (covers a period of time), and the Balance Sheet represents the position on a particular date only. When comparing the business Sales level with its Inventory level, it makes sense to use Avg.
- Inventory becomes more relevant in case of seasonal businesses. To compensate for the increased demand during peak season, it needs to build up more Inventory than the usual Average for the rest of the non-seasonal period.
- Inventory Holding provides various exciting insights into the performance of a company and the movement of Inventory in and out of business, which can further dwell into by the management to make better-informed business decisions.
Disclosure: This article contains affiliate links. If you sign up through these links, we may earn a small commission at no extra cost to you.
Frequently Asked Questions (FAQs)
1. What are the advantages of using the average inventory formula?
The average inventory formula offers a smoothed representation of inventory value over a specific period, helping to reduce fluctuations caused by seasonal or volatile demand. It provides a more accurate cost base for COGS calculations, aiding in better profit margin analysis and financial planning. This method is particularly useful for businesses with varying inventory levels yearly.
2. What are the limitations of the average inventory formula?
Despite its benefits, the average inventory formula might obscure sudden inventory changes, hindering precise insights into stockouts or excess stock. Additionally, it might not accurately reflect the financial impact of periods with significant inventory fluctuations. As a result, it might not be suitable for industries with rapidly changing demand or perishable goods.
3. What is the average inventory vs. total inventory formula?
Average inventory considers the average value of inventory over a specific period, aiding in cost calculations and financial analysis. On the other hand, the total inventory formula provides the exact snapshot of inventory value at a particular point in time, offering a detailed view of current stock levels. Both methods serve different purposes in inventory management and financial reporting.
Recommended Articles
This article has been a guide to the Average Inventory Formula. Here we learn how to calculate Average Inventory using its formula along with its uses, practical examples, and calculator. You can learn more about Accounting from the following articles –