Financial Analysis Definition
Financial analysis refers to an analysis of finance-related projects/activities or a company’s financial statements, which includes a balance sheet, income statement, and notes to accounts or financial ratios to evaluate the company’s results, performance, and its trend, which will be useful for taking significant decisions like investment and planning projects and financing activities. After assessing the company’s performance using financial data, a person presents findings to the top management of a company with recommendations about how it can improve in the future.
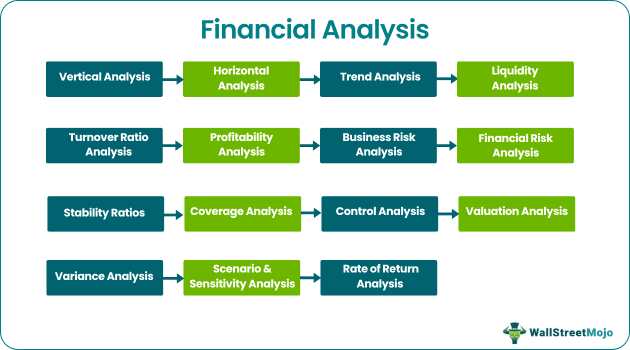
Top 15 Most commonly used financial analysis techniques are listed below –
- #1 – Vertical Analysis
- #2 – Horizontal Analysis
- #3 – Trend Analysis
- #4 – Liquidity Analysis
- #5 – Turnover Ratio Analysis
- #6 – Profitability Analysis
- #7 – Business Risk Analysis
- #8 – Financial Risk Analysis
- #9 – Stability Ratios
- #10 – Coverage Analysis
- #11 – Control Analysis
- #12 – Valuation Analysis
- #13 – Variance Analysis
- #14 – Scenario & Sensitivity Analysis
- #15 – Rate of Return Analysis
Let us discuss each one of them in detail –
- Financial analysis is the process of analyzing a company’s financial statements, including the balance sheet and income statement, to evaluate its financial health.
- Financial analysis involves recording and analyzing accounts and financial ratios to determine a company’s performance, trends, and areas for improvement.
- The findings from the financial analysis are presented to upper management, who use them to make informed decisions about investments, project planning, and financing activities.
- Financial analysis methods can help a company forecast its future financial performance and enable investors to make informed decisions about investing in the company based on its financial reports.
Top 15 Financials Analysis Techniques
There are many ways one can perform Financial analysis; the most popular types and tools are listed below –
#1 – Vertical Analysis

Vertical Analysis is a technique to identify how the company has applied its resources and in what proportion its resources are distributed across the income statement and the balance sheet. In the case of the Income Statement, each element of income and expenditure is defined as a percentage of total sales. The assets, liabilities, and shareholder’s equity are represented as a percentage of total assets.
To learn more on Vertical Financial Analysis, you can refer to the following articles –
- Vertical Analysis of Income Statement
- Vertical Analysis Formula
- Common Size Income Statement
- Common Size Balance Sheet
#2 – Horizontal Analysis
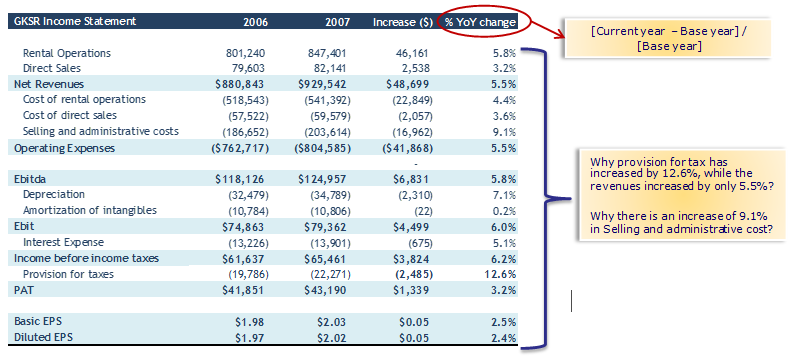
In Horizontal Analysis, the company’s financial statements are made to review for several years, and it is also called a long-term analysis. It is useful for long-term planning and compares figures of two or more years. Here we find out the current year’s growth rate compared to the previous year to identify opportunities and problems.
#3 – Trend Analysis

Trend analysis involves collecting the information from multiple periods and plotting the collected information on the horizontal line to find actionable patterns from the given information.
#4 – Liquidity Analysis
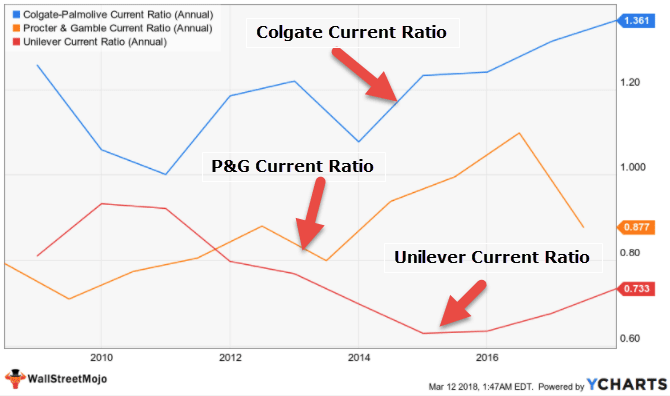
Liquidity Analysis determines the company’s ability to meet its short-term financial obligations and how it plans to maintain its short-term debt repayment ability. Ratios used for Liquidity Financial analysis are as follows
#5 – Turnover Ratio Analysis
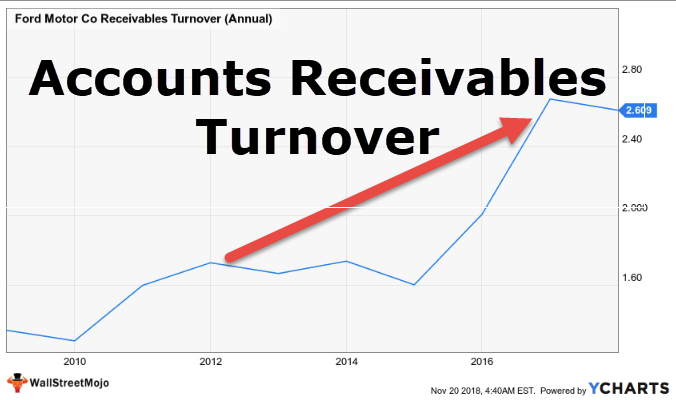
The turnover Ratio primarily identifies how efficiently the company’s resources are utilized. The following Ratios are used to do Turnover Analysis –
- Accounts Receivable Turnover
- Inventory Turnover Ratio
- Working Capital Turnover Ratio
- Asset Turnover Ratio
- Equity Turnover Ratio
- Days Payable Outstanding DPO
#6 – Profitability Analysis

Profitability financial analysis helps us understand how the company generates its profit from its business activities. The following tools are used to analyze the same –
#7 – Business Risk Analysis

Business Risk Analysis measures how investment in fixed assets affects the sensitivity of the company’s earnings and the debt on the balance sheet. The top ways to analyze Business Risk is as follows –
#8 – Financial Risk Analysis

Here we measure how leveraged the company is and its place concerning its debt repayment capacity. Tools used to do leverage financial analysis –
#9 – Stability Ratios
The stability ratio is used with a vision of the long-term. It is used to check whether the company is stable in the long run or not.

#10 – Coverage Analysis

This type of financial coverage analysis is used to calculate dividend, which needs to be paid to investors or interest to be paid to the lender.
#11 – Control Analysis
Control ratio from the name itself, it is clear that it used to control things by management. This type of ratio analysis helps management to check favorable or unfavorable performance.
There are mainly three types of ratios used here – Capacity Ratio, Activity Ratio, and Efficiency Ratio
- Capacity Ratio Formula = Actual Hour Worked / Budgeted Hour * 100
- Activity Ratio Formula = Standard Hours for Actual Production / Budgeted Standard Hour * 100
- Efficiency Ratio Formula = Standard Hours for Actual Production / Actual Hour Worked * 100
#12 – Valuation Analysis
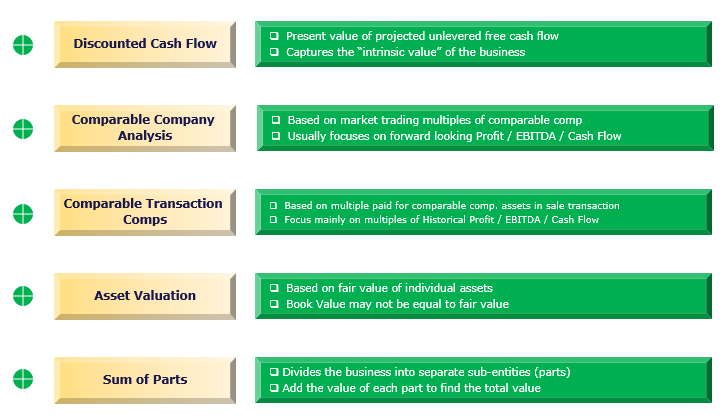
Valuation Analysis helps us identify the fair value of the business, investment, or company. While valuing a business, choosing the correct valuation methodology is very important. You may use one of the following valuation financial analysis tools –
- DDM
- Discounted Cash Flow Formula
- Trading Multiples
- Transaction Multiples Valuation
- Sum of the Parts Valuation
#13 – Variance Analysis
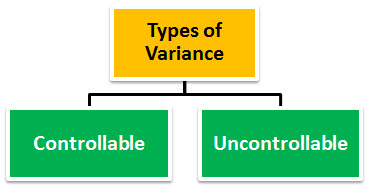
Variance analysis in budgeting is the study of the deviation of the actual outcome against the forecasted behavior in finance. It is essentially concerned with the difference between actual and planned behavior and how business performance is being impacted.
#14 – Scenario & Sensitivity Analysis
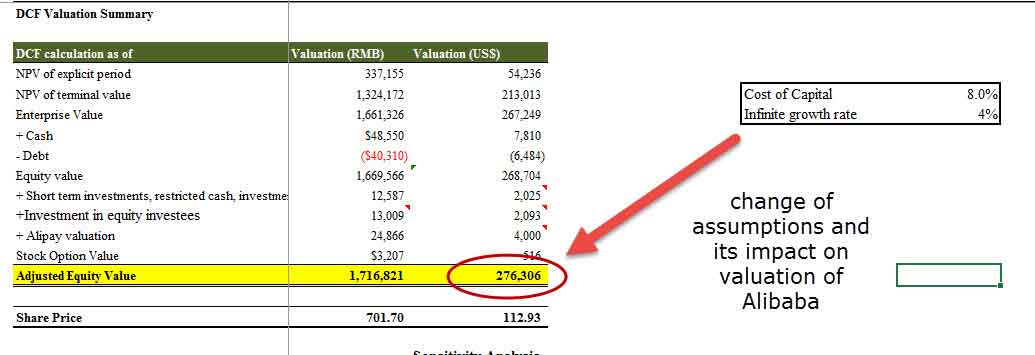
Scenario analysis takes account of all the scenarios and then analyzes them to find out the best and worst scenarios. You can use the following to do sensitivity analysis –
- Sensitivity Analysis in Excel
- Data Table in Excel
- Two-Variable Data Table in Excel
- One Variable Data Table in Excel
#15 – Rate of Return Analysis

The internal rate of return is a metric employed in capital budgeting, which is used to measure the extent of profitability of potential investments. It is also known as ERR or economic rate of return. IRR is defined as the discount rate that sets the NPV of a project to zero is the project’s IRR. The following tools can be used to rate of return analysis –
Advantages
- With the help of financial analysis, method management can examine the company’s health and stability.
- It provides investors an idea about deciding whether to invest a fund or not in a particular company, and it answers a question such as whether to invest? How much to invest? And what time to invest?
- It simplifies the financial statements, which helps compare companies of different sizes with one another.
- With the help of financial analysis, the company can predict the company’s future, forecast future market trends, and do future planning.
Disadvantages
- One of the disadvantages of financial analysis is that it uses facts and figures as per current market conditions, which may fluctuate.
- False data in the statement will give you false analysis, and companies may manipulate data, and it may not be accurate.
- Comparing different companies is not possible if they adopt other accounting policies.
- If any company is working in a rapidly changing and highly competitive environment, its past results in the financial statement may or may not be indicators of future results.
Limitations of Financial Analysis
- When companies do financial analysis, they often fail to consider the price changes, and due to this, they are unable to show inflation impact.
- It only considers the monetary aspects of companies’ financial statements and does not consider the non-monetary aspects of financial statements.
- It is based on past data in financial statements,s and future results can’t be like the past.
- Many Intangible assets are not recorded in the statement due to Intangible assets not considered while doing financial analysis.
- Due to different accounting policies, it is limited to a specific period and not always comparable with different companies’ statements
- Sometimes financial analysis influences personal judgment, and it doesn’t necessarily mean that strong financial statements analysis of companies have a strong financial future.
Conclusion
It is the systematic process of analyzing or examining the company’s financial information to reach a business decision. People in the company examine how stable, solvent, and profitable business or any company project is. These assessments are carried out by examining the company’s income statement, balance statement, and cash flow statement of the company.
Analysis and examination of Financial statements are essential tools in assessing the company’s health, and it provides information to company management. Then it is used by them for future planning and decision making. It helps the company to raise capital domestically as well as overseas. With the help of various Financial Analysis methods mentioned above, the company can predict a company’s future or individual projects. It helps company management make decisions by examining the recommendations made in a report. It helps investors whether to invest funds in a company or not by assessing its financial reports.
Frequently Asked Questions (FAQs)
1. What is financial analysis vs. financial modeling?
The financial analysis examines financial statements and other financial information to evaluate a company’s financial health and make informed decisions. On the other hand, financial modeling involves creating a mathematical representation of a company’s financial performance, usually using spreadsheet software, to forecast future financial outcomes.
2. What is financial analysis vs. technical analysis?
The financial analysis focuses on analyzing financial statements and other financial data to assess a company’s financial health and make informed investment decisions. On the other hand, technical analysis is a method of evaluating securities by analyzing statistics generated by market activity, such as price and volume, to predict future price movements.
3. What are financial analysis skills?
Financial analysis skills refer to the ability to analyze financial statements and other financial data to evaluate a company’s financial health, identify trends, and make informed decisions. These skills include knowledge of accounting principles, financial analysis techniques, and financial statement analysis.
Recommended Articles
This article has guided what financial analysis is and its definition. Here we discuss the top 15 most common financial analysis techniques, including their advantages, disadvantages, and limitations. You can learn more about financing from the following articles –