Part of our Solvency Ratios guide
What Is Quick Ratio?
The quick ratio, also known as the acid test ratio, measures the ability of the company to repay the short-term debts with the help of the most liquid assets. . It is also called the acid test ratio or liquid ratio.
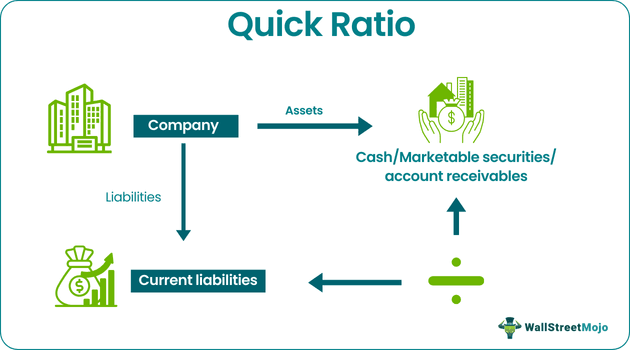
It is calculated by adding total cash and equivalents, accounts receivable, and the marketable investments of the company and then dividing it by its total current liabilities. It helps the investors estimate the company’s ability to clear out its current liabilities at the earliest or meet its obligations for the short term.
- The quick ratio is also known as the acid test ratio. It determines the company’s ability to repay short-term debts with the help of the most liquid assets.
- One may calculate it by adding total cash and equivalents, accounts receivable, and the company’s marketable investments. Then divide it by its total current liabilities.
- Current assets may contain a large inventory and prepaid expenses and may not be liquid. Thus, including stock may alter the current ratio from an immediate liquidity point of view. The quick ratio solves the problem by not considering inventory.
Quick Ratio Explained
Quick Ratio helps stakeholders measure an entity’s capacity to pay off its short term obligations by using its liquid assets like cash, accounts receivable and marketable securities.
It should be noted that current assets may contain a large inventory, and prepaid expenses may not be liquid. Therefore, including stock, such items will skew the current ratio from an immediate liquidity point of view. Quick ratio solves this problem by not taking inventory into account. To calculate quick ratio only the most liquid assets, including money and cash equivalents, and receivables are considered.
A higher than the average industry ratio may imply that the company is investing too much of its resources in the business’s working capital, which may be more profitable elsewhere. However, if the quick ratio is lower than the industry average, the company is taking a high risk and not maintaining adequate liquidity.
Quick Ratio Explanation in Video

Formula
Let us understand the formula used to calculate the quick ratio.
Quick Ratio Formula = Quick Assets / Quick Liabilities. = (Cash and Cash Equivalents + Accounts Receivables) / (Current liabilities – Bank Overdraft)
A ratio of 1: 1 indicates a highly solvent position. This ratio serves as a supplement to the current ratio in analyzing liquidity.
Due to the prohibition of inventory from the formula, this ratio is a better sign than the current ratio of the ability of a company to pay its instant obligations. It is also known as the acid test ratio or liquid ratio.
Calculation Examples
The following examples will help understand the concept.
Example #1
The following is the information extracted from audited records at a large industrial company. (Amount in $)
| Particulars | 2011 | 2012 | 2013 | 2014 | 2015 |
|---|---|---|---|---|---|
| Current Assets | 1,10,000 | 90,000 | 80,000 | 75,000 | 65,000 |
| Inventory | 8,000 | 12,000 | 8,000 | 5,000 | 5,000 |
| Current Liabilities | 66,000 | 70,000 | 82,000 | 1,00,000 | 1,00,000 |
| Bank Overdraft | 6,000 | 5,000 | 2,000 | 0 | 0 |
Assume that Current Assets = Cash and Cash Equivalents + Accounts Receivables + Inventory. There are no other items included in current assets.
An ideal quick ratio You must calculate the quick ratio and will help to analyze the ratio trend to judge the company’s short-term liquidity and solvency.
Answer to Example 1.
Calculation of the quick ratio of the company for the following years: by using the quick ratio accounting formula.
| Particulars | 2011 | 2012 | 2013 | 2014 | 2015 |
|---|---|---|---|---|---|
| Current assets ( A ) | 1,10,000 | 90,000 | 80,000 | 75,000 | 65,000 |
| Less: Inventory (B) | 8,000 | 12,000 | 8,000 | 5,000 | 5,000 |
| Quick Assets (C) = (A – B ) | 1,02,000 | 78,000 | 72,000 | 70,000 | 60,000 |
| Current Liabilities ( D ) | 66,000 | 70,000 | 82,000 | 80,000 | 80,000 |
| Less: Bank overdraft ( E ) | 6,000 | 5,000 | 2,000 | 0 | 0 |
| Quick Liabilities (F) = (D – E) | 60,000 | 65,000 | 80,000 | 80,000 | 80,000 |
| Quick Ratio = ( C ) / ( F ) | 1.7 | 1.2 | 0.9 | 0.875 | 0.75 |
(Amount in $)
From the above-calculated data, we analyzed that the quick ratio has fallen from 1.7 in 2011 to 0.6 in 2015. It must mean that most the current assets are locked up in stocks over time. The ideal standard quick ratio is 1: 1, which means that the company is not in a position to meet its immediate current liabilities; it may lead to technical solvency. Hence, one should take steps to reduce the investment in the inventory and see that the ratio is above level 1: 1.
The ideal standard ratio is 1: 1. However, the company is not in a position to meet its immediate current liabilities; it may lead to technical solvency. Hence, one should take steps to reduce the investment in the inventory and see that the ratio is above level 1: 1.
Example #2
XYZ Ltd. provides you with the following information for the year ending 31st March 2015: –
- Working Capital = $45,000
- Current ratio = 2.5
- Inventory = $40,000
Here the quick ratio accounting formula is used to calculate and interpret It.
Answer to Example 2
- Calculation of current assets and current liabilities
Working capital = $45,000
Current ratio = 2.5
= Current assets / Current liabilities = 2.5 = Current assets = 2.5 * Current Liabilities
So, working capital = Current Assets – Current Liabilities
= 45,000
= 2.5 Current Liabilities – current liabilities
= 1.5 * current liabilities = 45,000
Current liabilities = 45,000 / 1.5 = 30,000
Therefore, current assets = 2.5 * current liabilities = 2.5 * 30,000 = 75,000
So, current assets and liabilities are $75,000 and $30,000, respectively.
- Calculation of acid test ratio
Given Inventory = $40,000
Current assets = $75,000
So, Quick assets = Current assets – Inventory = $75,000 – $40,000 = $35,000
As no bank overdraft is available, current liabilities will be considered quick liabilities.
So, the quick liabilities = $30,000
Therefore,
Ratio = Quick assets / Quick liabilities
Ratio = $35,000 / $30,000
Ratio = 1.167
As the calculated acid test ratio is 1.167, which is more than the ideal ratio of 1, the company can better meet its obligation through quick assets.
Example #3
P&G’s current ratio was healthy at 1.098x in 2016. However, its quick ratio is 0.576x. It implies that many of P&G’s current assets are stuck in lesser liquid assets like inventory or prepaid expenses.

Interpretation
- It is a sign of an organization’s solvency and should be analyzed over time and in the industry’s circumstances the company controls in.
- Companies should focus on keeping this ratio that maintains adequate leverage against liquidity risk, given the variables in a particular business sector, among other considerations.
- The more uncertain the business environment, the more likely companies would keep higher quick ratios. Reversely, where cash flows are constant and foreseeable, companies would call on to maintain the quick ratio at relatively lower levels. Companies must attain the correct balance between liquidity risk caused by a low ratio and the risk of loss caused due to a high ratio.
- An acid ratio higher than the industry average may be advised that the company is investing too many resources in the business working capital, which may more profitably be used elsewhere.
- If a company has extra supplementary cash, it may consider investing the excess funds in new ventures. On the other hand, if the company is out of investment choices, it may be advisable to return the surplus funds to shareholders in hiked dividend payments.
- The acid test ratio, which is lower than the industry average, may suggest that the company is taking a high risk by not maintaining a proper shield of liquid resources. Otherwise, a company may have a lower ratio due to better credit terms with suppliers than its competitors.
- While interpreting and analyzing the acid ratio over various periods, it is necessary to take into account seasonal changes in some industries, which may produce the ratio to be traditionally higher or lower at certain times of the year as seasonal businesses experience illegitimate effusion of activities leading to changing levels current assets and liabilities over the time.
Importance
This ratio is one of the major tools for decision-making. It previews the ability of the company to make a settlement of its quick liabilities in a very short notice period.
- This ratio eliminates the closing stock from the calculation, which may not always be necessary to be taken as a liquid, thereby giving a more suitable profile of the company’s liquidity position.
- Since closing stock is separated from current assets and bank overdrafts and cash credit are eliminated from current liabilities, and closing stock usually secures them, thereby preparing the ratio to ensure its liquidity position.
- Evaluation of closing stock can be sensitive and may not always be at retail value. Therefore, the quick ratio is not impaired, as there is no requirement for the valuation of the closing stock.
- Closing stock can be very seasonal and may vary in quantities over a yearly period. I contemplate it may collapse or escalate its liquidity status. The ratio does away with this issue by ignoring closing stock from the calculation.
- In a sinking industry, which generally may have a very high closing stock level, this ratio will help provide the company with a more authentic repayment ability against the current ratio, including closing stock.
- Because of the major inventory base, one may overstate the short-term financial strength of a company if the current ratio is utilized. By using this ratio, one can tackle this situation. In addition, it will limit companies from getting an additional loan, the servicing of which may not be as simple as reflected by the current ratio.
Quick Ratio Vs Current Ratio
Quick ratio analysis interprets the company’s ability to meet short-term obligations by using liquid assets without inventory whereas the current ratio takes inventory into consideration. However, let us understand the differences between them.
| Quick Ratio | Current Ratio |
| It does not include inventory in its calculation. | It includes inventory in its calculation. |
| It divides cash, account receivable, and marketable securities by current liabilities. | It divides all current assets by current liabilities. |
| It is a very stringent approach. | This approach is more relaxed. |
| It takes into account assets that can be converted to cash in 90 days or less. | It takes into account assets that can be converted to cash in a year. |
Frequently Asked Questions (FAQs)
How to improve the quick ratio?
One is to improve the quick ratio by increasing sales and inventory turnover. Moreover, they may also opt for discounting, increasing marketing, and providing incentives to the sales staff may also be used to boost sales. However, as a result, it will increase inventory turnover.
Is quick ratio a percentage?
The quick ratio is mentioned as a number rather than a percentage. It is because the number determines the liquid assets available for the corresponding current liabilities.
What quick ratio is good?
An excellent quick ratio is above one or 1:1. A percentage of 1:1 means the company has similar liquid assets as current liabilities. A higher ratio means the company may pay off current liabilities several times.
Is the quick ratio the same as the acid test?
The quick ratio determines a company’s current assets by its current liabilities. The acid test ratio is more rigid than the quick ratio as it does not remove inventory from existing assets. Instead, the stock may be sold shortly to pay the company’s
Recommended Articles
Guide to what is Quick Ratio. We explain its formula, vs current ratio along with interpretation, examples, and importance. You may also have a look at these articles for enhancing your knowledge of accounting: