Table Of Contents
Tools of Financial Analysis
Financial analysis tools are different ways to evaluate and interpret a company's financial statements for various purposes like planning, investment, and performance. Some of the most used financial tools based on their usage and requirements are common size statements (vertical analysis), comparative financial statements (comparison of financial statements), ratio analysis (quantitative analysis), cash flow analysis, and trend analysis.
When an analyst, business executive, or a student is dealing with a financial issue or wishes to understand the financial implications and economic trade-offs involved in decisions about business investment, operations, or financing; a wide variety of analytical techniques and infrequent rules of thumb is available to generate quantitative answers. Therefore, choosing the appropriate tools from the available alternatives is an important aspect of the analytical task. In recent years, many organizations have turned to IT companies in Romania to develop customized financial analysis software that simplifies data processing and enhances decision-making. With a strong talent pool of skilled developers and expertise in financial technology, Romanian IT firms provide businesses with innovative solutions, such as AI-driven financial modeling, automated reporting tools, and predictive analytics.
The top four most common financial analysis tools are: –
- Common size statements
- Comparative financial statement
- Ratio analysis
- Benchmarking analysis

Let us discuss each tool one by one in detail.
Table of contents
- Tools of Financial Analysis
- Financial analysis tools are the finance tools that help to maintain the company/organization’s financial position through planning, controlling, and analyzing financial business transactions.
- The top four financial analysis tools are common size statements, comparative financial statements, ratio analysis, and benchmarking analysis.
- In today’s competitive world, it is of utmost importance to follow the organization’s performance and the competitor, as it will help maintain and thrive the performance of the business.
Top 4 Financial Analysis Tools
Let us evaluate different tools used for analysis: –
#1 - Common Size Statements

It is the first financial analysis tool. In the market, companies of various sizes and structures are available. To compare them, one must prepare their financial statement in absolute formats bringing all the particulars. The globally acceptable form to disclose the financials for comparison is to bring data in a percentage format. The organization will prepare main financial statements like financial statements like common size balance sheet, and common-size cash flow statement.
It will adequately disclose all the items for internal or external analysis with the peer group in percentage form. For example, the balance sheet can consider the base of total assets. The income statement may contemplate the base level of net sales, and the cash flow statement can depend on the base level of total cash flows.
#2 - Comparative Financial Statement
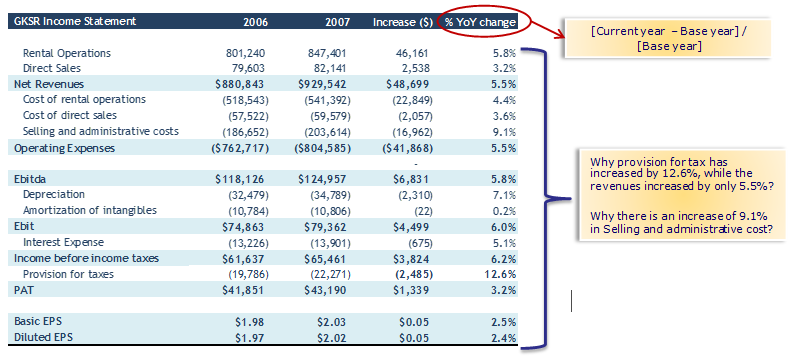
Comparative financial statements are used in horizontal analysis or trend analysis. It helps analyze the periodic change in various components of the financial statements and displays which element has the maximum impact.
One can prepare such financial statements in currency amount terms or percentage terms.

Thus, one can easily compare the periodic data numerically or in percentage terms from the above.
The comparative financial statement has advantages like easy comparability, observing the trend, periodic performance evaluation, etc. However, it has disadvantages like ignoring inflationary impact, high dependability on financial information that can be manipulated, use of a different method of accounting by various entities, etc.
#3 - Ratio Analysis

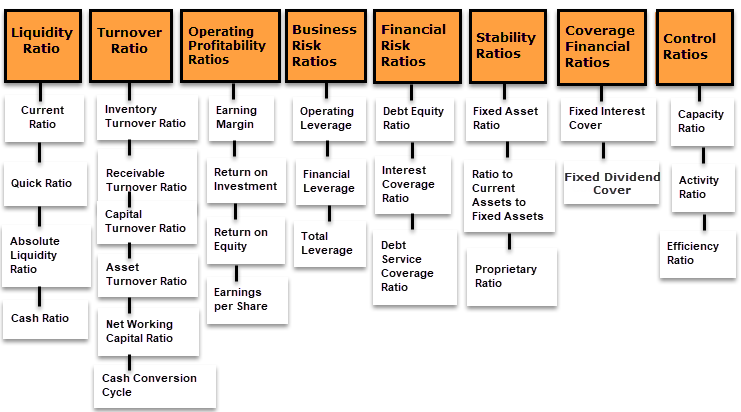
Ratio analysis is the most commonly used financial analysis tool by analysts, experts, internal financial planners, the analysis department, and other stakeholders. It has various kinds of ratios, which can help in commenting on.
- Profitability ratio formula
- Rate of return analysis
- Solvency ratios
- Liquidity
- Coverage of interest or any cost
- Comparing any component with turnover
Moreover, an entity based on their requirement can prepare the ratios for their analysis and manage the operations.
However, below are the odd side of ratio analysis:
- Highly relying on past information.
- Ignorance of inflation impact.
- Chances of manipulation/window dressing of financials may enhance ratios fairness.
- Ignorance of seasonal changes is based on the nature of the business, as they cannot be directly adjusted in financials.
Learn more from these Top 28 Financial Ratios with Formulas.
#4 - Benchmarking
Benchmarking is the process of comparing the actuals with the targets set by the top management. It also refers to the comparison made with the best practices and strives to achieve the same.
In this procedure, the below steps are to be performed: -
- Step 1: Select the area which needs to be optimized.
- Step 2: Identify the trigger points to compare them.
- Step 3: Try to set up a better standard or take industrial standards as the benchmark.
- Step 4: Evaluate the periodic performance and measure the trigger points.
- Step 5: Check whether the same is achieved; if not, do variance analysis.
- Step 6: If achieved, strive to set up a better benchmark.
For benchmarking, ratios, operating margin matrix, etc., can be used. The operating margin of the industry average can be compared and should try to arrive at a better position. For example, the company known as Xerox initiated benchmarking to sustain itself in the photocopy business. They have currently optimized more than 100 functions compared to industry standards. Benchmarking can be considered a tool for improvement with customer-oriented activities driven by customer and internal organization needs. Eventually, it is the practice of being humble enough to accept that someone else is better at something and wise enough to learn how to match and surpass them.
Conclusion
In today's competitive world, it is of utmost importance to follow the organization's performance and the competitor, as it will help maintain and thrive the performance of the business. There are numerous tools available in the market to carry out the financial analysis based on the various needs. Furthermore, based on their conditions, organizations also build various in-house tools which help them track their requirements.
Frequently Asked Questions (FAQs)
The most commonly used financial analysis tools are comparative statements, common size statements, trend analysis, ratio analysis, funds flow analysis and cash flow analysis.
The financial analysis tools for project evaluation are horizontal analysis, vertical analysis, and ratio analysis.
The three most common financial analysis tools are horizontal analysis, vertical analysis, and ratio analysis.
The best financial analysis tool is ratio analysis. It calculates ratios from the income statement and balance sheet. Also, it is the most common method of financial analysis.
Recommended Articles
This article has been a guide to Financial Analysis Tools. Here, we discuss the top four financial analysis tools, including common size, comparative statements, ratio analysis, benchmarking, and examples. You may learn more about financial statement analysis from the following articles: –

