What Are Profitability Ratios?
Profitability ratios help determine and evaluate the company’s ability to generate the income against the expenses it incurs and consider the different elements of the balance sheet and profit and loss account of the company for analyzing the company’s performance.
It helps stakeholders assess the entity’s ability to earn revenue through the optimum use of assets, capital investments, cost control, etc. The gross profit ratio, net profit ratio, operating profit ratio, and return on investment are some. Any two relevant numerical values are selected from the financial statement for comparison.
Profitability Ratios Explained
Calculating profitability ratios help a company and its stakeholders determine how much profitable the company is, based on certain numerical financial data taken from the financial statements. It is a criteria based on which investors make investment decisions and the influence the stock prices, growth and future expansion.
Financial profitability ratios helps in peer comparison between companies in same industry and also predict the chance or opportunity for future growth based on the type of current performance. Therefore it shows how well the business is using the shareholder’s capital and the various assets for generating profit and adding value to the business.
Types
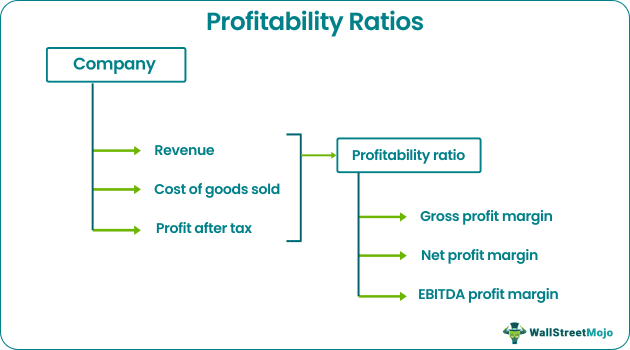
There are different types of financial profitability ratios that companies use to track their operating performance. However, in this article, we will discuss those based on margin. Three major ratios in this list are gross profit margin, net profit margin, and EBITDA margin, which will cover here.
#1 – Gross Profit Margin Ratio
The gross profit is calculated by deducting all the direct expenses called cost of goods sold from the sales revenue. The cost of goods sold primarily includes raw materials and the labor expense incurred for production. Finally, the gross profit margin is calculated by dividing the gross profit by the sales revenue and expressed in percentages.
Below is the formula to calculate this profitability ratio:-
Gross Profit Margin = (Revenue – Cost of Goods Sold) / Revenue*100%
#2 – Net Profit Margin Ratio
The net profit, called Profit After Tax (PAT), is calculated by deducting all the direct and indirect expenses from the sales revenue. Then the net profit margin is calculated by dividing the net profit by the sales revenue and is expressed in percentages.
Below is the formula to calculate this profitability ratio:-
Net Profit Margin = PAT / Revenue * 100%
#3 – EBITDA Margin Ratio
The EBITDA is calculated by adding interest expense, taxes, depreciation, and amortization expense to net profit or profit after tax. Then, the EBITDA margin is calculated by dividing the EBITDA by the sales revenue and is expressed in percentages.
Profitability Ratios Video Explanation

Formula
Given below are the formula for calculating profitability ratios which are most widely used.

How To Calculate?
#1 – How to Calculate Gross Profit Margin?
One can calculate the formula for gross profit margin by using the following steps: –
- Step #1: Firstly, the sales revenue is taken from the profit and loss account.
- Step #2: Then, the cost of goods sold is calculated, which is the summation of raw material consumed, labor expense, and other similar direct expense attributable to the product’s manufacturing. All the information is easily available from the profit and loss account.
- Cost of Goods Sold = Raw Material Cost + Labor Expense + Other Direct Expenses
- Step #3: The gross profit is calculated by deducting the cost of goods sold from the sales revenue.
- Step #4: Finally, the gross profit margin is calculated by dividing the gross profit by the sales revenue and multiplying by 100%.
- Gross Profit Margin = (Revenue – Cost of Goods Sold) / Revenue * 100%
#2 – How to Calculate Net Profit Margin?
One can calculate the formula for net profit margin by using the following steps: –
- Step #1: The sales revenue is calculated as described above.
- Step #2: The Net Profit After Tax (NPAT) is captured and categorically mentioned as a separate line item in the profit and loss account.
- Step #3: Finally, the net profit margin is calculated by dividing the Net Profit After Tax (NPAT) by the sales revenue multiplied by 100%.
- Net Profit Margin = PAT / Revenue * 100%
#3 – How to Calculate EBITDA Margin?
EBITDA margin formula is given below. It can be calculated by using the following steps.
Following are the steps for the calculation of the EBITDA margin:-
- Firstly, the sales revenue is calculated as described above.
- Interest expense, depreciation, amortization, and paid taxes are taken from the profit and loss account.
- Then, EBITDA is calculated by adding back interest expense, depreciation amortization expense, and taxes paid to PAT.
EBITDA = PAT + Interest + Taxes + Depreciation and Amortization
- Finally, the EBITDA margin is calculated by dividing the EBITDA by the sales revenue and multiplying by 100%.
EBITDA Margin = EBITDA / Revenue * 100%
Thus given above are the methods of calculating some key profitability ratios.
Examples
Below we have taken some practical examples to understand this concept.
Let us consider an example to calculate the key profitability ratios for XYZ Ltd., which is in the business of manufacturing customized roller skates for both professional and amateur skaters. At the end of the financial year, XYZ Ltd. had earned $150,000 in total net sales and the following expenses.
In the below template is the data for the calculation: –

From the given information,
#1 – Gross profit
= Net sales – Cost of goods sold
So, from the above calculation, gross profit will be 80000
#2 – Net profit = $31,000
#3 – EBITDA
= Net profit + Interest expense + Tax + Depreciation expense
So, from the above calculation, EBITDA will be: –

Now, the Profitability ratios,
- Gross profit margin
- = Gross profit / Net sales * 100
=53.33%
- Net Profit Margin
- = Net profit / Net sales*100%
=20.67%
- EBITDA Margin
- = EBITDA / Net sales*100%
=46.67%
Profitability Ratio Analysis in Excel
Now let us take the real-life example of Apple Inc. to illustrate the different profitability ratios in the Excel template below. The table provides detailed calculations using different profitability ratio formulas.

We note the following about the profitability ratios of Apple Inc.: –
- The net profit margin has increased from 21.19% in 2016 to 22.41% in 2018.
- On the other hand, the gross profit margin has decreased from 39.08% to 38.34%.
- Likewise, the EBITDA margin has reduced from 34.01% to 32.77%.
Importance
Some importance of good profitability ratios are as follows:
- Good profitability ratios are used to assess how a company performs, measured by calculating profitability at different levels, i.e., gross profit, profit after tax, and EBITDA.
- These ratios show the percentage of sales at different levels absorbed by the operating expense. Hence, the lower the operating expense ratio, the higher the profitability, indicating better performance.
- However, there remains a limitation of the profitability ratio as it is useful only when comparing companies in the same industry.
Limitations
Some limitations of these ratios are given below.
- The ratios do not consider the risks that any business faces to earn the revenue and profits that the ratios are using for calculation.
- It is possible to manipulate the financial data of any company. In that case, the ratio will not show the actual financial condition of the company.
- Different companies might have different methods of displaying financial data. This makes the use of ratio for profitability analysis hard for comparison purpose.
- It takes into account a limited time frame. Any new investment, expansion plan takes time to show good result. The ratios are not able to capture the positive results because they do not come immediately.
- These ratios show the status of the current performance but cannot forecast the future.
Recommended Articles
This article is a guide to what are Profitability Ratios. We explain their formula with examples, types, how to calculate, importance & analysis in excel. You can learn more about financial analysis from the following articles: –