Difference Between NASDAQ and Dow Jones
NASDAQ and Dow Jones have been used interchangeably, but have different meanings.
Key Takeaways
- Dow refers to Dow Jones Industrial Average (DJIA), a crucial stock market index globally.
- On the other hand, NASDAQ refers to the National Association of Securities Dealers Automated Quotients Exchange, an electronic exchange system.
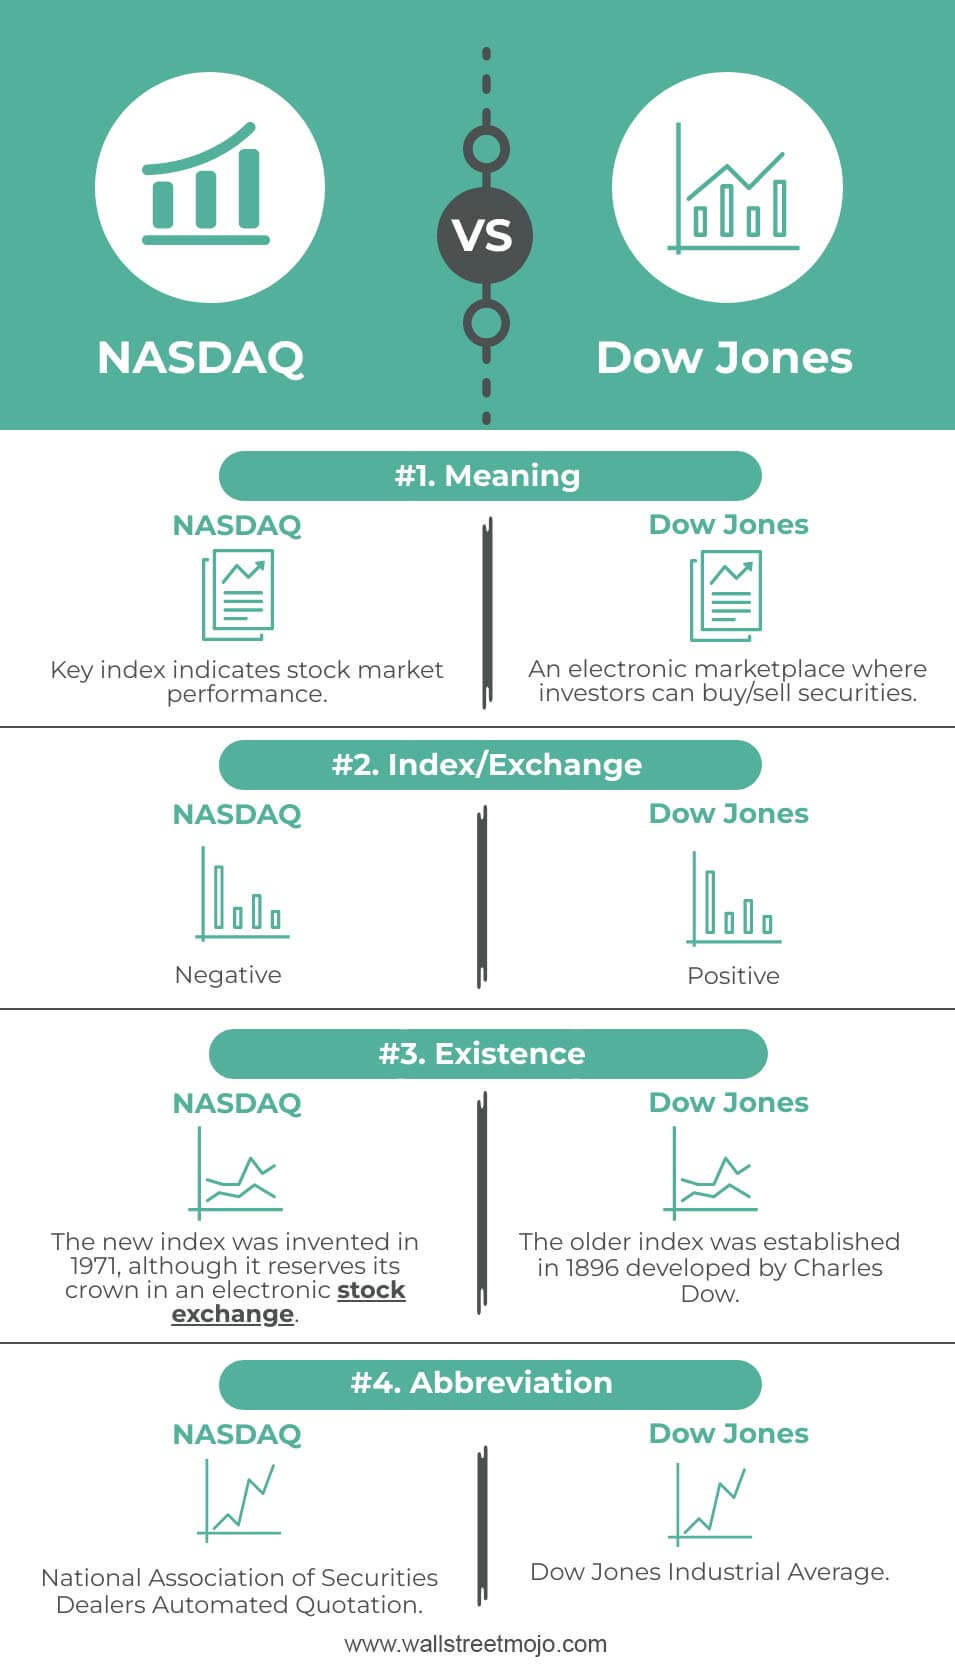
NASDAQ vs. Dow Jones Infographics
Here are the top 4 differences between NASDAQ vs. Dow Jones.
Many traders use Saxo Bank International to research and invest in stocks across different markets. Its features like SAXO Stocks offer access to a wide range of global equities for investors.
Key Differences
- NASDAQ is a U.S. stock market index containing around 3,000 companies. In contrast, the DJIA comprises 30 major industry leaders and major contributors to the industry and the stock market.
- NASDAQ primarily includes technology-based corporations such as Apple, Google, and several other companies in their growth stages. DJIA is circulating the companies’ earnings, and they may be pulled off if the stock prices falter.
- NASDAQ is based on the company’s outstanding stock value, i.e., on multiple companies’ index market capitalization. Dow Jones is a price-weighted average index indicating that any stock split or adjustment is not considered in the average price computation. Thus, if one firm falters in the share price, the value of the entire index can deteriorate. E.g., in 2008, the value of the AIG fell from $451 to $54 due to the financial crisis, and the market, in turn, fell by 3,000 points.
- The rise and fall of the NASDAQ stock market depend largely on the technology sector’s performance. Still, in the case of DJIA, the operation is focused on the 30 major companies as a group and not as individual stocks.
- NASDAQ stock market has three different market tiers, namely: –
- The capital market (Small cap), an equity market for companies with small market capitalization and listing requirements, is less stringent.
- Global Market (Mid Cap) consists of around 1,500 stocks representing NASDAQ global markets and have to meet strict financial and liquidity requirements. In addition, it is also required to meet equivalent Corporate Governance Standards.
- Global Stock Market (Large Cap) is a market capitalization-weighted index of U.S.-based and international stocks. It has met more stringent requirements than the mid-cap stocks and is more exclusive than the others. The listing department periodically reviews the performance and the rules governing the stocks in this category.
On the other hand, Investment in DJIA is Accessible Through
- ETF (Exchange Trade funds), including Leverage or Short strategies. Due to improvements in premarket trading, ETFs offer a more accurate opening value for the average.
- Futures Contract: Dow futures are critical premarket tools and indicate how the DJIA will open.
- Options Contract.
NASDAQ Quotes are Available at 3 Levels
- Level 1 shows the highest bid and lowest ask.
- Level 2 displays all public quotes of market makers and associated information of market dealers who are willing to buy or sell stock and recently executed orders.
- Level 3 is used by market makers to enter their quotes and perform them.
DJIA calculation is computed by taking the sum price of all 30 stocks and dividing them by the Dow Divisor. This divisor gets adjusted concerning DJIA calculation is computed by taking the sum price of all 30 stocks and dividing them by the Dow Divisor. This divisor gets adjusted with respect to stock splits, spin-offs, or similar structural changes for more accuracy.
NASDAQ vs. Dow Jones Comparative Table
| Basis of Comparison | NASDAQ | Dow Jones |
| Meaning | Key index indicates stock market performance. | An electronic marketplace where investors can buy/sell securities. |
| Index/Exchange | Both an index and exchange. | Only an index of 30 major companies. |
| Existence | The new index was invented in 1971, although it reserves its crown in an electronic stock exchange. | The older index was established in 1896 developed by Charles Dow. |
| Abbreviation | National Association of Securities Dealers Automated Quotation. | Dow Jones Industrial Average. |
NASDAQ to Dow Jones Ratio
It is an interactive chart that shows the ratio of the NASDAQ Composite Index to the DJIA. As reflected in the DJIA, a high ratio indicates a high bullishness since high momentum technology stocks can attract more investor funds than traditional industrial firms. In addition, it is observed that if the stock market index of both Dow and Index is increasing positively in the same direction, it indicates the economy is in good health. Below is an example of the chart indicating the ratio of both indexes. It clearly shows that during 1999-2000, the ratio was very high, which was due to the dot-com bubble incident.
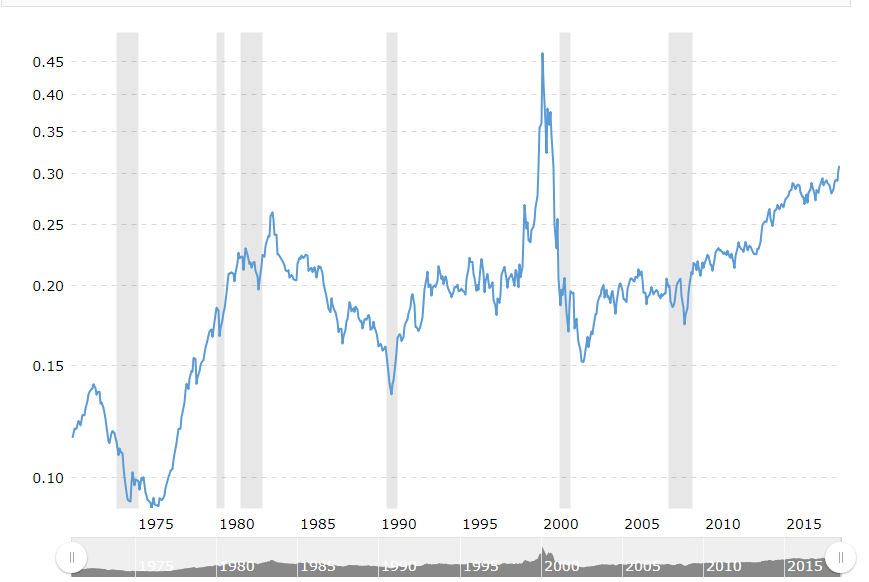
source: macrotrends.net
Conclusion
One should note that though both NASDAQ and Dow refer to the market indices, only the NASDAQ where investors can buy and sell stocks. Additionally, an investor can’t trade on the indexes as NASDAQ and DOW represent a mathematical average that people use to understand the market. Instead, investors can purchase index funds or ETFs (exchange-traded funds).
Disclosure: This article contains affiliate links. If you sign up through these links, we may earn a small commission at no extra cost to you.
Recommended Articles
This article has been a guide to NASDAQ vs. Dow Jones. Here, we discuss the top differences between NASDAQ and Dow Jones, infographics, and a comparison table. You may also have a look at the following articles: –