What Is Log Normal Distribution?
A log normal distribution is a continuous distribution of random variables whose logarithms distribute normally. In other words, the lognormal distribution generates by the function of ex, where x (random variable) is supposed to distribute normally. In the natural logarithm of ex is the x, the logarithms of lognormally distributed random variables distributed normally.
Asset price analysis is one of the various applications of lognormal distribution used in finance. The expected return on assets graphs in a normal distribution, but the prices of the assets graph in a lognormal distribution.
Key Takeaways
- A lognormal distribution is a continuous random variables distribution whose logarithms usually distribute. In other words, the ex function creates the lognormal distribution, where x (random variable) distributes typically.
- In the natural logarithm of ex is the x, the logarithms of lognormally distributed random variables distributed normally.
- The mean and standard deviation explain the formula for the probability density function of the lognormal distribution.
- The normal distribution is the probability distribution, which is the asymmetrical and bell-shaped curve.
Log Normal Distribution Explained
The log-normal distribution models the probability distribution of stock and many other asset prices. For instance, we have observed a lognormal appearing in the Black-Scholes-Merton option pricing model, where there is an assumption that the price of an underlying asset option distributes lognormally simultaneously.
The following three parameters characterize the log-normal distribution:
- σ, the standard deviation of the distribution log, is also called the shape parameter. The shape parameter generally affects the overall shape of the lognormal distribution, but it does not impact the location and height of the graph.
- m, the median of the distribution, also known as the scale parameter.
- Θ, the location parameter which is used to locate the graph on the x-axis.
The mean and standard deviation are two major parameters of the lognormal distribution, and these two parameters explicitly define it.
Formula
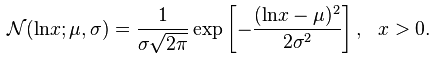
The log normal distribution formula for the probability density function is derived using the mean μ and standard deviation σ, which is denoted by:
Examples
The following are some log normal distribution examples where one can use it:
- The volume of gas in energy and petroleum reserves.
- The volume of milk production.
- The quantity of rainfall.
- The potential lives of manufacturing and industrial units whose chances for survival characterize by the stress rate.
- The extent of periods to which any infectious disease exists.
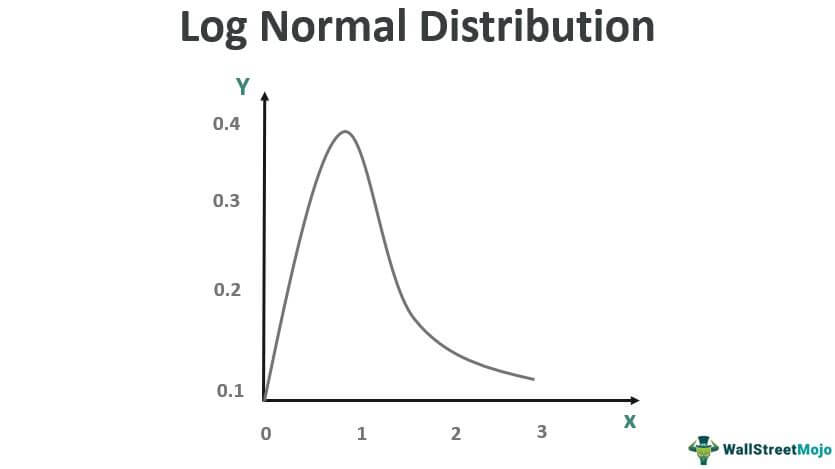
Graph
A variable X is normally distributed if Y = ln(X), where ln is the natural logarithm.
- Y= ex
- Let’s assume a natural logarithm on both sides.
- lnY = ln ex which results into lnY = x
Therefore, if X, a random variable, has a normal distribution, Y has a lognormal distribution.
Properties
The following figure illustrates the normal distribution and log normal distribution.
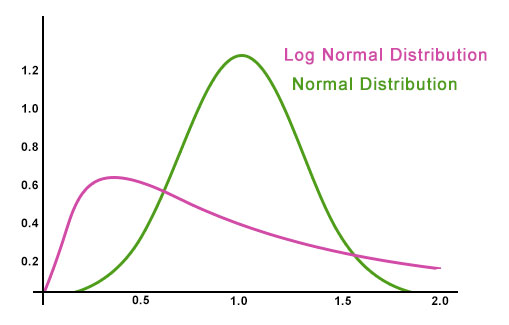
The above figure, we can note the following features of the log normal distribution.
- The log normal distributions are positively skewed to the right due to lower mean values and higher variance in the random variables in consideration.
- The lognormal distribution is always bounded from below by 0 as it helps in modeling the asset prices, which are unexpected to carry negative values.
- The lognormal distribution is skewed positively with a large number of small values. However, it includes a few significant values, which result in the mean being greater than the mode very often.
The above figure shows that the log normal distribution is bounded by 0. Furthermore, it positively skewed to the right, which its long tail could notice towards the right. These two observations consider the major properties of lognormal distributions. In practice, lognormal distributions proved very helpful in distributing equity or asset prices. In contrast, the normal distribution is useful in estimating the asset’s expected returns over time.
When To Use?
The most commonly used and popular distribution is a normal distribution, which is normally distributed and symmetrical and forms a bell-shaped curve that has modeled various naturals from simple to very complex.
But there are instances where normal distribution faces constraints where lognormal distribution can be easily applied. For example, the normal distribution can consider a negative random variable, but the lognormal distribution envisages only positive random variables.
- With the help of the lognormal distribution curve, we can easily calculate the compound rate of return on assets over time.
- If we applied a normal distribution to calculate asset prices over time, there are possibilities of getting returns less than -100%, which subsequently assumes the prices of assets are less than 0. But suppose we use lognormal distribution to estimate the compound rate of return over some time. In that case, we can easily ward off the situation of getting negative returns as lognormal distribution considers only positive random variables.
- A price relative is the asset’s price at the end of the period divided by the initial price of the asset, which is equal to 1 plus holding period returns. To find the end of the asset of the period price, we can get the same by multiplying it by the relative price times the initial asset price. Lognormal distribution takes only positive value; therefore, the asset price at the end of the period cannot be below 0.
Log Normal Distribution Vs Normal Distribution
The normal distribution is the probability distribution, which is the asymmetrical and bell-shaped curve. In a normal distribution, 69% of the outcome falls within one standard deviation, and 95% falls within two standard deviations.
- Due to the popularity of normal distribution, most people are familiar with the concept and application of normal distribution. Still, at the time, they didn’t seem equally familiar with the concept of the log normal distribution. One can convert the normal distribution into a lognormal distribution with the help of logarithms, which becomes the fundamental basis as the lognormal distributions consider the only random variable distributed normally.
- One can use the lognormal distributions in conjunction with the normal distribution. Lognormal distributions are the outcome of assuming the ln, natural logarithm in which base is equal to e = 2.718. In addition to the given base, the lognormal distribution can be made using another base, which would subsequently impact the shape of the lognormal distribution.
- The lognormal distribution graphs the log of normally distributed random variables from the normal distribution curves. The ln, the natural log, is known as e, the exponent to which one should raise a base to get the desired random variable x, which one could find on the normal distribution curve.
Frequently Asked Questions (FAQs)
When to use lognormal distribution?
Normal or lognormal distributions are commonly used when complete information is not available. For example, one may use the lognormal distribution to express load variables, whereas the normal distribution represents resistance variables.
Can lognormal distribution be negative?
Each value in a lognormal distribution is positive. In addition, negative values and zeroes are impossible in a lognormal distribution.
What are the properties of a lognormal distribution?
The lognormal distribution has the following properties:
a. The distribution is positively skewed, meaning it has a long right tail.
b. The distribution is defined only for positive values since the logarithm of zero or negative values is undefined.
c. The mean and variance of the lognormal distribution depend on the parameters of the underlying normal distribution of the logarithm.
How is the lognormal distribution related to the geometric mean?
The geometric mean of a set of positive values is related to the lognormal distribution. If the logarithms of the deals are typically distributed, then the exponentiated values correspond to the geometric mean.
Recommended Articles
This article has been a guide to what is Log Normal Distribution. We explain its formula with examples, graph, properties, and when to use & vs normal distribution. You can learn more about finance from the following articles: –