Part of our Investment Banking guide
What Does A Financial Analysts Do?
A financial analyst analyzes a project or a company to suggest viable investment decisions to the management/clients. They do a thorough financial analysis and make suitable objective projections to arrive at their conclusions.
Financial analysts gather and work on data from balance sheets, income statements, and market trends to evaluate a company’s performance.
Financial analysts are professionals in companies, banks, hospitals, insurance companies, and many other businesses that involve huge transactional activities, and deal with maintaining huge financial details. They evaluate financial data to help companies make informed investment, budgeting, or business decisions.
A tiny mistake in maintaining records and strategizing finances could lead to adverse boomeranging effects. Hence, relevant skills and the best possible knowledge in the subject are what build an efficient financial analyst. To strengthen these capabilities, professionals often pursue a finance analytics certification that validates their ability to analyze financial data, support forecasting, and contribute to informed decision-making
Key Takeaways
- A financial analyst assesses projects or companies to guide management or clients on investment decisions.
- They conduct comprehensive financial analyses, use structured information to create objective projections, and reach informed conclusions.
- Financial analysts perform various tasks, including data collection, organizing information, financial modeling, forecasting, evaluating financial outcomes, making recommendations,
- and preparing recommendation reports. Their goal is to support effective decision-making in financial matters.
- Financial analysts stay updated with market trends, economic conditions, and industry developments to provide accurate
- and relevant insights for informed decision-making by monitoring and analyzing financial news, reports, and industry data.
- They work in areas like corporate finance, insurance, investment banks, and portfolio management.
Roles & Responsibilities
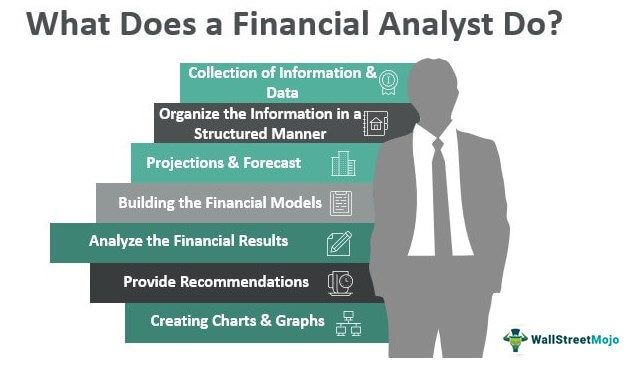
#1 – Collection of Information & Data
A financial analyst collects information and data relevant for analysis. In addition, they analyze information such as historical financial statements, transactional reports from accounting software, information about the movement in stock prices, industry research information, statistical information about the company’s products or services, and macroeconomic information relevant to the company.
The fundamental question arises, who will provide him with such information? Financial analysts must gather the data from the company itself or from Bloomberg or any other government websites wherein such information is available to the general public. One can extract historical financial statements from the Securities and Exchange Commission (SEC) website.
#2 – Organize the Information in a Structured Manner
In answer to our question on what does a financial analyst do, he is also responsible for the structural organization of relevant data from various sources for better decision-making and usability. Thus, the financial analyst must sort the information according to the data received or the category. The Excel skills of the financial analyst help him to organize the better in the least possible time.
#3 – Projections & Forecast
No one knows the future, but we still predict and plan for it! Companies also do the same. They take a base and use assumptions to arrive at certain projections. Sometimes, the client company provides the points and forecasts. Then, the analyst checks the projections’ reasonableness. It is easy for an analyst to predict the future of the company’s prospects with his vast knowledge. It involves the art and science of probabilities where they make certain assumptions and work on those assumptions.
Advertisement
#4 – Building the Financial Models
A financial model in Excel is the biggest bread and butter for a financial analyst. So, it is an important work area for someone in investment banking, corporate finance, and equity research. The most famous financial models are Discounted Cash Flow Analysis (also known as the DCF model), Leveraged Buyout model (LBO), and Merger & Acquisition model (M&A).
#5 – Analyse the Financial Results
Once the analyst organizes the data in a required format, the next job is the analysis of various ratios and metrics tools. Some of the key ratios used in the analysis are gross profit margin, operating profit margin, net profit margin, the variable cost to sales ratio, debt-equity ratio, return on capital employed, return on equity, current ratio, net working capital, creditors payment period and debtors collection period. There are many more ratios and metrics which a financial analyst can use for better comfort in decision-making. That is one of their main areas of work, and hence it needs sufficient time allocation.
#6 – Provide Recommendations
Based on the analysis made, the job of the financial analyst is to provide a recommendation. For example, a proposal may include an investor or business perspective. Investor perspective means whether to buy, hold or sell the stock. On the other hand, a business perspective means areas of improvement in the operations of the entity. Such areas include cost reduction techniques, exploring new markets, ideas of becoming a debt-free company, operational efficiencies, etc. A good analyst easily provides investor perspective recommendations, but only some experts can recommend a business perspective.
#7 – Presenting the Recommendation
After preparing a draft of the recommendation, they eventually worked it out in Microsoft PowerPoint to provide structured guidance. Presentation is the selling skill of a financial analyst. The way they present the information recommendation defines their approach to doing work.
#8 – Creating Charts & Graphs
It is an integral part of the presentation. Any financial analysis is incomplete without charts and graphs explaining the various sets of information. Charts and graphs help the reader capture the data in certain lines or bars.
Financial Analyst – Video Explanation

Types of Financial Analysts
We have seen what does a financial analyst do, in detail. Some of the main types of financial analysts include:
- Investment Analyst
- Treasury Analyst
- Risk Analyst
- Corporate Financial Analyst
- M&A Analyst (Mergers & Acquisitions)
- Private Equity Analyst
- Financial Planning & Analysis (FP&A) Analyst
- Portfolio Analyst
- Real Estate Financial Analyst
Frequently Asked Questions (FAQs)
What industries typically employ financial analysts?
Financial analysts are employed across various industries, including banking and financial services, investment firms, insurance companies, consulting firms, and corporate finance departments of businesses in diverse sectors.
What tools and software do financial analysts use in their work?
Financial analysts commonly utilize tools such as spreadsheets (e.g., Excel), financial modeling software, data analysis tools (e.g., SQL), financial research platforms (e.g., Bloomberg), and presentation software (e.g., PowerPoint) to analyze data, create financial models and present findings.
What are the career prospects for financial analysts?
Career prospects for financial analysts are generally favorable, with opportunities for growth and advancement. As financial analysis is a crucial aspect of decision-making in organizations, skilled analysts can explore roles such as senior financial analyst, portfolio manager, investment banker, or financial planning and analysis (FP&A) manager.
What educational background is typically required to become a financial analyst?
A bachelor’s degree in finance, accounting, economics, or a related field is typically required to become a financial analyst. However, some employers may prefer or require a master’s degree in finance, business administration (MBA), or a related discipline. In addition, professional certifications such as Chartered Financial Analyst (CFA) can also enhance career prospects.
Find a financial analyst career exciting?
You can check out our complete Financial Analyst Certification Course here.
Recommended Articles
This article is a guide to guide to What Does a Financial Analyst Do. We explain their roles or responsibilities from collecting data to presenting them. You may find more about finance in the following articles: –